See crime rates for the safest cities.
Minnesota’s Safest Cities of 2024

Here are the 10 Safest Cities in Minnesota for 2024
In our most recent State of Safety survey, residents of Minnesota (43%) were less likely to worry about their safety on a daily basis than most Americans (47%). This makes sense since Minnesota’s crime rates fall below the national rates for both property crime and violent crime.
All of Minnesota's 20 safest cities reported violent crime and property crime rates well below the state average.
In this report

Download the full list of cities in your state
Enter your email to get the full list with crime stats.
By signing up, you agree to our Terms and Conditions and Privacy Policy.
NOTE: If your city is missing from our full report, it means that it was below the population threshold or didn’t submit a complete crime report to the FBI in 2022.
2024 Minnesota crime rates
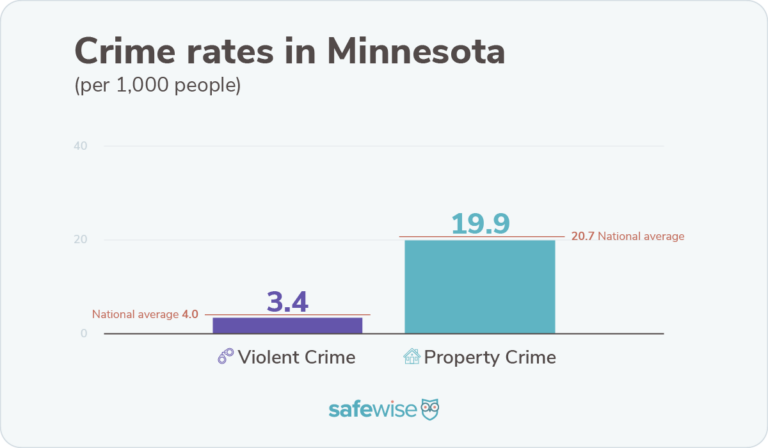
Image: SafeWise
Minnesota's violent crime rate rose from 3.2 incidents per 1,000 people to 3.4, while property crime decreased from 20.6 per 1,000 to 19.9.
Even with the increase in Minnesota's violent crime rate this year, the state remained below the national average (4.0), coming in as the fifteenth lowest state for per capita violent crime. Its property crime rate is 4% lower than the national rate of 20.7 incidents per 1,000 people.
Property crime in Minnesota: Fear vs. reality
This is the second consecutive year where property crime has gone down statewide. Even so, the state is ranked twentieth highest in property crime.
- Minnesotans reported more personal experiences with property crime this year (28%)—17% higher than last year.
- 41% of survey respondents reported experiencing package theft in the 12 months prior to the survey (US 35%).
- 37% of respondents said they increased security measures in the 12 months prior to the survey.
- 29% of Minnesotans surveyed say they don't use any form of property protection (US 25%).
- The top form of property protection in Minnesota this year is security cameras with 39% using them (US 39%).
What security measures do Minnesotan use most?
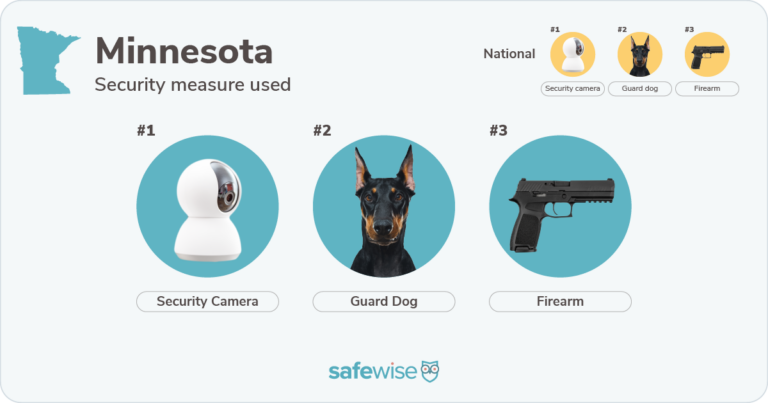
Image: SafeWise
Compare the best home security systems
Brand | Installation | Monthly cost
| Best for | Starter equipment price | Contract required | Smart home compatibility
| Learn more |
| Professional | $29.99/mo. | Best professional home security | $599.00 | No * | Amazon, Google, Z-Wave | View packages | |
| Professional | $28.99/mo. | Most trusted security brand | $0.00 | Yes | Amazon, Google, Z-Wave | View packages | |
| DIY or Pro | $17.99/mo. | Best customer rating | Quote required Online quiz | No * | Amazon, Google | View packages | |
| DIY | $20.00/mo | Best budget-friendly pick | $199.99 | No | Amazon, Google, Z-Wave | View on Amazon | |
| DIY or Pro | $19.99/mo. | Best DIY home security | $245.00 | No | Amazon, | View packages |


Info current as of post date. Offers and availability may vary by location and are subject to change. Read full disclaimer.
Full ADT disclaimer
What crimes are Minnesota residents concerned about most?
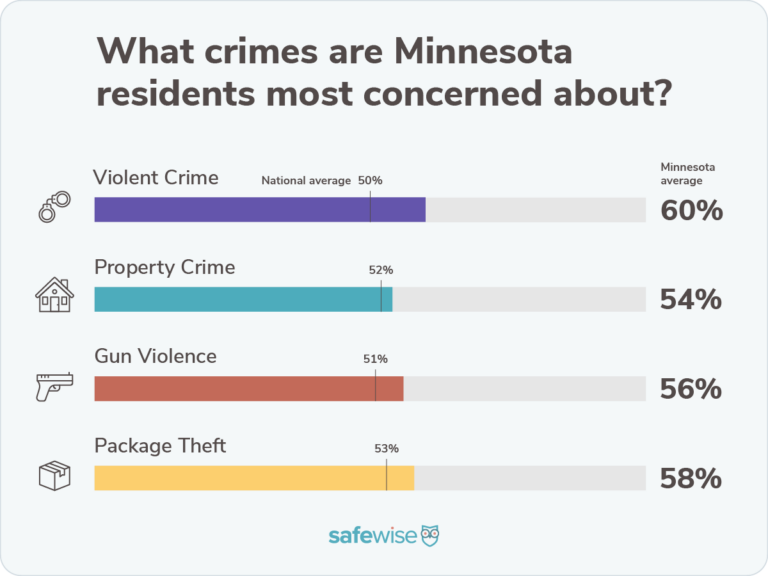
Image: SafeWise
Violent crime in Minnesota: Fear vs. reality
A slight rise in Minnesota's violent crime rate this year reflects that more than four in 10 survey respondents (41%) don't feel safe in the state. This growing unease is out of step with a decrease in personal experiences with violent crime and gun violence compared to the last reporting year.
- 41% of Minnesota residents report feeling safe in their state compared to 45% of Americans.
- 12% of survey participants reported having a personal experience with violent crime in the 12 months prior to our survey—7 percentage points lower than the previous year, and the tenth-lowest in the US.
- Although this is the fourth consecutive year the violent crime rate has risen, Minnesota still has the fifteenth lowest violent crime rate in the nation.
- 29% of respondents use some form of personal protection—lower than the national average of 36%.
- Pocket knives are the most-used form of personal protection, followed by pepper spray.
Attitudes about gun violence in Minnesota
Overall, gun violence is a bigger concern for The North Star State than the year before with a 27% increase in gun violence worries. Fortunately, fewer survey respondents reported a personal experience with gun violence this year (12%) compared to last year's report (16%).
- 56% of Minnesotans said they were concerned about gun violence—lower than the US average of 51%.
- There were 12 mass shootings in Minnesota in 2023, matching the two previous years.
- 31% of respondents use a concealed firearm for personal protection and 23% use a firearm to protect their home.
A closer look at the safest cities in Minnesota
For the purposes of this report, the terms “dangerous” and “safest” refer explicitly to crime rates as calculated from FBI crime data—no other characterization of any community is implied or intended.
- 142 cities qualified for ranking this year.
- 5 of the top 20 safest cities are new to our list this year: Goodview, Elko New Market, Lonsdale, Bayport, and St. Charles.
- No city reported more than 1 violent crime per 1,000 residents.
- Montevideo held on to the #1 spot for the second consecutive year.
- Goodview and New Ulm join Montevideo with zero violent crimes reported in the reporting year.
- Belle Plaine made a big move on this year's report, jumping 38 spots to round out the top 20.
- Every safest city reported fewer than 8 property crimes per 1,000 people.
- 5 cities saw zero burglaries: Montevideo, Goodview, Elko New Market, Bayport, and Hibbing.
The 20 safest cities in Minnesota
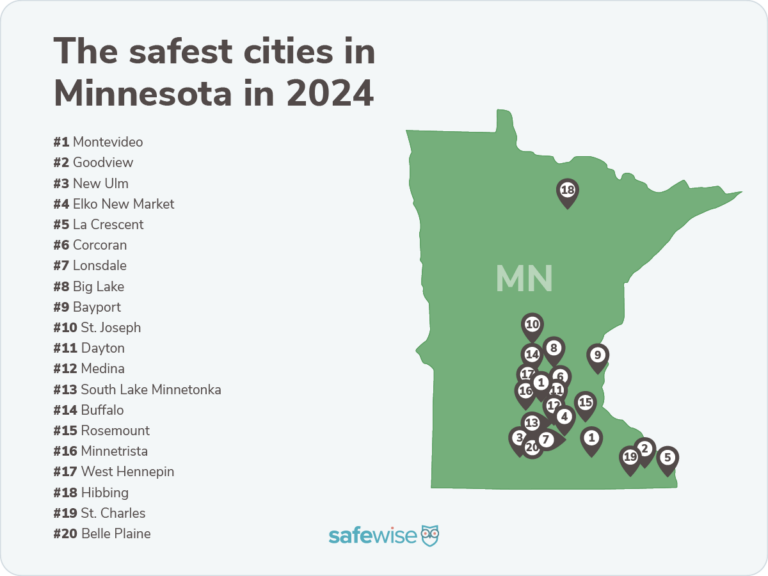
Image: SafeWise
#1
Montevideo
(
-0-
)-
 Population5,180
 -
 VC Rate 2024, 2023, 20220.0, 0.4, 0.8
 -
 PC Rate 2024, 2023, 20220.4, 0.0, 3.2
 -
 VC=Violent crime, PC=Property crime

#2
Goodview
(
New
)-
Population4,137
-
VC Rate 2024, 2023, 20220.0, N/A, 1.2
-
PC Rate 2024, 2023, 20220.5, N/A, 13.6
-
VC=Violent crime, PC=Property crime

#3
New Ulm
(
 )
)
+15
-
Population14,067
-
VC Rate 2024, 2023, 20220.0, 0.5, 0.7
-
PC Rate 2024, 2023, 20221.6, 9.6, 9.2
-
VC=Violent crime, PC=Property crime
#4
Elko New Market
(
New
)-
Population4,995
-
VC Rate 2024, 2023, 20220.2, N/A, 0.0
-
PC Rate 2024, 2023, 20223.0, N/A, 4.5
-
VC=Violent crime, PC=Property crime

#5
La Crescent
(
)
+2
-
Population5,222
-
VC Rate 2024, 2023, 20220.4, 0.0, 0.8
-
PC Rate 2024, 2023, 20221.9, 8.8, 16.3
-
VC=Violent crime, PC=Property crime

#6
Corcoran
(
 )
)
-4
-
Population7,295
-
VC Rate 2024, 2023, 20220.3, 0.1, 0.0
-
PC Rate 2024, 2023, 20223.4, 5.5, 3.6
-
VC=Violent crime, PC=Property crime

#7
Lonsdale
(
New
)-
Population4,908
-
VC Rate 2024, 2023, 20220.4, N/A, 0.5
-
PC Rate 2024, 2023, 20222.6, N/A, 8.2
-
VC=Violent crime, PC=Property crime

#8
Big Lake
(
)
-4
-
Population12,625
-
VC Rate 2024, 2023, 20220.6, 0.4, 1.1
-
PC Rate 2024, 2023, 20222.6, 4.9, 4.1
-
VC=Violent crime, PC=Property crime

#9
Bayport
(
New
)-
Population3,912
-
VC Rate 2024, 2023, 20220.5, N/A, 0.3
-
PC Rate 2024, 2023, 20224.1, N/A, 7.1
-
VC=Violent crime, PC=Property crime

#10
St. Joseph
(
)
+4
-
Population6,937
-
VC Rate 2024, 2023, 20220.4, 0.6, 0.3
-
PC Rate 2024, 2023, 20224.9, 5.8, 8.2
-
VC=Violent crime, PC=Property crime

#11
Dayton
(
)
-5
-
Population9,078
-
VC Rate 2024, 2023, 20220.2, 0.5, 0.4
-
PC Rate 2024, 2023, 20226.5, 4.9, 7.3
-
VC=Violent crime, PC=Property crime

#12
Medina
(
-0-
)-
Population6,753
-
VC Rate 2024, 2023, 20220.4, 0.1, 0.7
-
PC Rate 2024, 2023, 20225.0, 9.2, 10.8
-
VC=Violent crime, PC=Property crime

#13
South Lake Minnetonka
(
)
+2
-
Population12,391
-
VC Rate 2024, 2023, 20220.3, 0.6, 0.6
-
PC Rate 2024, 2023, 20226.1, 6.3, 6.7
-
VC=Violent crime, PC=Property crime
#14
Buffalo
(
)
-1
-
Population16,531
-
VC Rate 2024, 2023, 20220.1, 0.4, 0.7
-
PC Rate 2024, 2023, 20227.5, 7.7, 13.7
-
VC=Violent crime, PC=Property crime

#15
Rosemount
(
)
+5
-
Population27,503
-
VC Rate 2024, 2023, 20220.5, 1.0, 0.3
-
PC Rate 2024, 2023, 20225.9, 6.9, 6.8
-
VC=Violent crime, PC=Property crime

#16
Minnetrista
(
)
-5
-
Population10,959
-
VC Rate 2024, 2023, 20220.4, 0.3, 0.6
-
PC Rate 2024, 2023, 20226.8, 8.0, 4.6
-
VC=Violent crime, PC=Property crime

#17
West Hennepin
(
)
-14
-
Population5,311
-
VC Rate 2024, 2023, 20220.4, 0.2, 0.0
-
PC Rate 2024, 2023, 20226.8, 5.9, 8.2
-
VC=Violent crime, PC=Property crime

#18
Hibbing
(
)
-13
-
Population15,980
-
VC Rate 2024, 2023, 20220.3, 0.3, 1.3
-
PC Rate 2024, 2023, 20227.8, 6.2, 12.2
-
VC=Violent crime, PC=Property crime

#19
St. Charles
(
New
)-
Population4,001
-
VC Rate 2024, 2023, 20220.7, N/A, 0.5
-
PC Rate 2024, 2023, 20225.5, N/A, 9.8
-
VC=Violent crime, PC=Property crime

#20
Belle Plaine
(
)
+18
-
Population7,440
-
VC Rate 2024, 2023, 20220.7, 1.4, 1.1
-
PC Rate 2024, 2023, 20226.6, 10.6, 7.2
-
VC=Violent crime, PC=Property crime
How we determined the safest cities
Learn how we identified the safest cities on our methodology page.
How to make a safe home anywhere
Over 6 in 10 Americans surveyed don't have a home security system, despite over 50% of all burglaries being residential. Unfortunately, a majority of people who have a security system added it after they had a break-in. One of the best ways to stop a burglary before it happens—and get immediate help if a break-in is detected—is to add a monitored home security system.
Get a home security system
Find out which companies we recommend for every budget and lifestyle in our roundup of the Best Home Security Systems—and learn the basics with our guide on Everything You Need to Know About Home Security.
Find security and safety resources in your area
Related articles on SafeWise
Endnotes and sources
Find all endnotes and sources in our full methodology.
FBI Crime Data Explorer, "Documents & Downloads." Accessed March 18, 2024.
- 2022 and 2021 Crime in the United States Annual Reports
- Offenses Known to Law Enforcement
- 2022 NIBRS Estimation Tables
Bureau of Justice Statistics, "National Incident-Based Reporting System (NIBRS)." Accessed March 18, 2024.
Gun Violence Archive, "Mass Shootings." Accessed March 18, 2023.
SafeWise experts have years of firsthand experience testing the products we recommend. Learn how we test and review.
Recent Articles
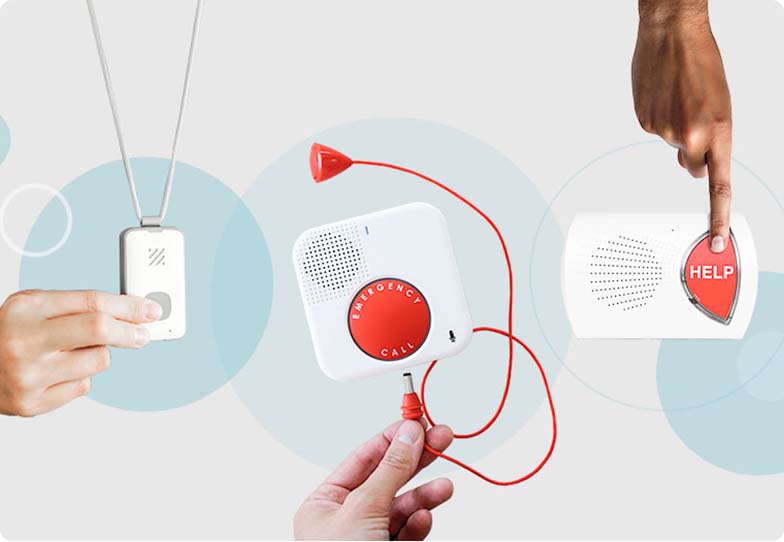
Best Medical Alert Systems
See which medical alert system is the best to keep you and your loved one...

Best Apartment Security Systems
These renter-friendly apartment security systems help keep you safe and require less commitment than your...

Best Home Security Systems
After thousands of hours of tests and research, we picked Vivint and SimpliSafe as the...

The Best Home Security Systems in Canada
Find the best home alarm system to protect your house. We looked at price, features,...