The Most Burglarized City in Every State

Why you can trust SafeWise
products considered
250+
research hours in 25+ in-home tests
10k+
years of combined experience
176+
homes and people protected
10M+

The most-burglarized city in every state

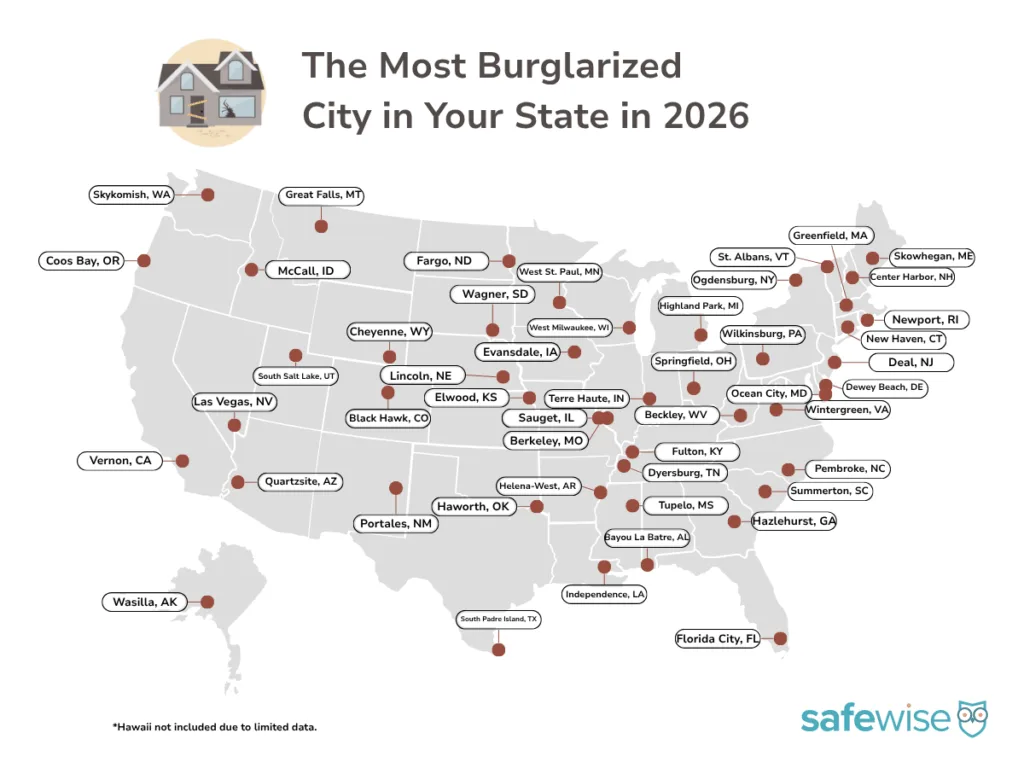
We dug into the numbers to find the most-burglarized city in every state (measured by burglary rate per capita) — and the results may surprise you. Burglars clearly don’t play favorites when it comes to city size.

Among the hot spots, 16 cities (33%) have populations over 15,000, while nine (18%) have fewer than 1,000 residents. No place is too big — or too small — for a break-in. These data underscore the need for security measures, as no place is immune to a potential burglary.

While burglary was the third-most common property crime in 2024, accounting for 12% of all reported incidents, it's important to note that this is only the second consecutive year in which motor vehicle theft has outpaced burglary. However, with 53% of all burglaries targeting residential properties, remaining vigilant against this threat is a must.

Now that you know the score, you can take proactive steps to protect your property. Want to know where burglars are busiest in your state (and where a security system might earn its keep)? Check out the the full list below and start planning your home defense strategy.

Bell
Burglary is big money

In 2024, burglars got away with an average of $6,000 in loot per incident — about five times more than victims lost in 2000.

Source: SafeWise

A closer look at the most-burglarized cities in every state

  • The top 5 cities with the most burglaries per capita are Vernon, California; Sauget, Illinois; Haworth, Oklahoma; Black Hawk, Colorado; and Pembroke, North Carolina.
  • Vernon, California is a major outlier, with 67 burglaries reported among a population of 205. That works out to nearly 33 burglaries per 100 people — about 3 times more than the next most-burglarized city, Sauget, Illinois, with about 11 burglaries per 100 people.
  • 44 (89%) of the cities on the list had fewer than 2 burglaries per 100 people.
  • 32 cities (65%) reported fewer than 1 burglary per 100 people.
  • Only 6 cities report more than 2 burglaries per 100 residents.
  • Black Hawk, Colorado is the smallest city on the list with 128 residents. Las Vegas, Nevada is the most populous with 1.7 million — but Black Hawk has 6 times as many burglaries per 100 people as Las Vegas (3.13 versus 0.47, respectively).
  • 4 cities have more than 100,000 residents, but each of those reports fewer than 1 burglaries per 100 people. (Las Vegas NV; Lincoln, NE; New Haven, CT; and Fargo, ND)
  • 67% of the cities (33) have populations below 15,000, but that's still 3 times larger than the majority of U.S. incorporated places — 76% have fewer than 5,000 residents.
  • Hawaii is the only state not included in this listing, due to limited crime reporting from that state. You can learn more about crime in Hawaii in our State of Safety in Hawaii report.

The full list: Find your state's most-burglarized city

State
Most-burglarized city
City population
City's total burglaries in 2024
Burglary rate* Icon Tooltip  Dark
AlabamaBayou La Batre2,142321.49
AlaskaWasilla10,240580.57
ArizonaQuartzsite2,382271.13
ArkansasHelena-West Helena8,4041121.33
CaliforniaVernon2056732.68
ColoradoBlack Hawk12843.13
ConnecticutNew Haven137,2435210.38
DelawareDewey Beach40671.72
FloridaFlorida City12,4411040.84
GeorgiaHazlehurst4,066360.89
IdahoMcCall4,188150.36
IllinoisSauget1301511.54
IndianaTerre Haute58,5364000.68
IowaEvansdale4,468290.65
KansasElwood1,124161.42
KentuckyFulton2,266170.75
LouisianaIndependence1,655291.75
MaineSkowhegan8,700390.45
MarylandOcean City6,938640.92
MassachusettsGreenfield17,4191030.59
MichiganHighland Park8,280750.91
MinnesotaWest St. Paul22,1281570.71
MississippiTupelo37,5934231.13
MissouriBerkeley7,970790.99
MontanaGreat Falls60,4142500.41
NebraskaLincoln295,8087770.26
NevadaLas Vegas Metropolitan Police Department1,716,565"8,006"0.47
New HampshireCenter Harbor1,04740.38
New JerseyDeal885111.24
New MexicoPortales11,7721771.50
New YorkOgdensburg9,125650.71
North CarolinaPembroke2,836853.00
North DakotaFargo135,6821,0110.75
OhioSpringfield57,9115160.89
OklahomaHaworth284155.28
OregonCoos Bay15,4691480.96
PennsylvaniaWilkinsburg13,646550.40
Rhode IslandNewport24,957630.25
South CarolinaSummerton782162.05
South DakotaWagner1,407110.78
TennesseeDyersburg15,9171510.95
TexasSouth Padre Island2,030331.63
UtahSouth Salt Lake25,9301560.60
VermontSt. Albans6,958470.68
VirginiaWintergreen50330.60
WashingtonSkykomish15321.31
West VirginiaBeckley16,3671460.89
WisconsinWest Milwaukee3,990330.83
WyomingCheyenne65,1432590.40

Survey: The State of Home Security in 2025

Our first-ever State of Home Security Survey gives us a snapshot of how Americans are protecting their homes against break-ins — whether they live in a burglary hot spot or not.

With burglary rates varying widely across U.S. cities, these insights reveal not only which systems households trust the most, but also the main reasons people invest in home security. They show a clear picture of consumer behavior — who is buying security systems, what features matter most, and how satisfied they are with their protection.

Highlights from the State of Home Security survey

  • Decision triggers: Nearly 1 in 3 (29%) people install a security system to prevent a future break-in, with another 18% purchasing because of worries about neighborhood crime, and 10% adding one after falling victim to a crime.
  • Top home security brands: Ring (27%) and ADT (22%) account for nearly half the market, far outpacing other brands. Brands like SimpliSafe, Brinks, and Vivint carve out smaller shares, while 20% of users turn to local providers or “other” options.
  • Cost counts: The vast majority of households (55%) spend $50 or less per month for professional monitoring, and most (56%) invest $500 or less on equipment and installation. With the average loss from a burglary floating around $6,000, an annual cost of $1,100 (or less) for protection seems worth it.
  • User profiles: Homeowners (78%) are more likely to use a security system than renters  (22%), which is unsurprising given that people who live in a single-family house are about 6 times more likely to have a system than apartment-dwellers. It's important to note that apartments may have other security measures provided by the property management.
  • Favorite devices: Security cameras lead the way as the most common security add-on (65% use an outdoor camera and 43% have an indoor one), often paired with motion and entrance sensors for layered protection.
  • Pro vs. DIY: Consumers are split down the middle when it comes to installation, but self-monitoring edges out professional monitoring 55% to 45%.
  • How people buy: Recommendations from friends and family is the number one consideration when choosing a security system, followed by recommendations from online marketplaces and comparison sites like SafeWise.
  • Customer satisfaction: Most people are satisfied or very satisfied with their home security experience — from customer service (71%) to installation (82%), equipment (89%),  and home security apps (82%).

Methodology

To find the most-burglarized city in each state, we analyzed the most recent FBI burglary statistics and population data.1 We excluded cities with populations below 100 and any that didn’t report complete data to the FBI in 2023 (the most recent year for which complete data was available). 

To even the playing field, we calculated the number of burglaries reported per 100 people in each city that qualified in every state. The city with the highest number of burglaries per 100 people for each state landed on our list.

Hawaii was excluded because there weren’t enough city data to analyze; only one city provided burglary data in 2023. Washington, D.C. was also excluded.

Find out more about how we analyze crime data on our methodology page.


Sources

1. FBI Crime Data Explorer, "Documents & Downloads."

  • 2024 Crime in the United States Annual Reports
    • Offenses Known to Law Enforcement
  • 2024 NIBRS Estimation Tables

2. Bureau of Justice Statistics, "National Incident-Based Reporting System (NIBRS)."

3. SafeWise, "The State of Safety in America 2025," July 2025. 

Compare top-rated home security companies available nationwide

Brand
Self-monitoring option
Monthly cost Icon Tooltip  Dark
Starter equipment price
Break-in deterrent(s) Icon Tooltip  Dark
Smart home compatibility Icon Tooltip  Dark
Learn more
Icon No  LightNo
$0.00Smart AI detection, 2-way talk, Yard sign/window decalGoogle,
Z-Wave
Icon Yes  LightYes
$250.96Active Guard, AI detection, Live agent intervention, SirenAmazon,
Google
Icon No  LightNo
$199.00Smart Deter lurker detection, Lights, Sounds Amazon,
Google,
Z-Wave
Icon No  LightNo
CustomMotion sensors/cameras, Glass break sensor, SirenAmazon, Google
Icon Yes  LightYes
$65.00Acoustic/vibration sensors, AI-powered alerts, Smart security integrationAmazon, Google, Apple, Z-Wave, Zigbee

Info current as of post date. Offers and availability may vary by location and are subject to change. *ADT $28.99 for landline system only. Full ADT disclaimer

Rebecca Edwards
Written by
Rebecca is the Managing Editor and lead safety expert at SafeWise.com, where she's been researching, testing, and writing about home and personal security for over 12 years. Her safety smarts come from both real life and professional experience—as a single parent trying out safety and security gadgets to protect her family and a former college director responsible for safety plans and strategies to keep buildings, grounds, and hundreds of students and faculty safe every day. With 30 years of experience as a journalist and blogger, she's become a go-to source for trustworthy, practical advice on everything from the best home security systems and smart gadgets to keeping kids safe online, preventing package theft, and understanding crime trends nationwide. PBS NewsHour, The Today Show, NPR, Vice, TechCrunch, The Washington Post, HGTV, Marketplace, On the House, and more have featured Rebecca's expert insights and recommendations. Whether it's protecting your home, your loved ones, or your peace of mind, Rebecca makes safety simple, doable, and real.

Recent Articles

Map showing location pins for the city in each state with the highest burglary rate.
The Most Burglarized City in Every State
We found the most-burglarized city in every state — it looks like burglars are equal...
Ring Alarm security system unboxed.
Ring Security vs. Frontpoint
Frontpoint is our pick in this DIY security system matchup. Its starter package is more...
Technician installing a smoke alarm
Best Smoke Detectors of 2026
We reviewed the top fire and smoke alarms for your home in 2026. Protect your...
Oklahoma Sues Roblox, Calls It a “Hunting Ground for Child Predators”
Oklahoma's lawsuit is the 148th currently active against Roblox. Learn why this popular gaming platform...