100 Safest Cities in the US

Rebecca Edwards
Mar 21, 2025
Icon Time To Read7 min read
Icon CheckData Analysis ByDaniel Delgado

For over 11 years, SafeWise experts have conducted independent research and testing to write unbiased, human reviews (not robots). Learn more.

11th annual Safest Cities report banner

Rebecca helps you stay safe without the stress | Managing Editor | 12+ yrs in home + personal security | 30+ yrs in journalism | Expertise featured by NYT, PBS, Today Show, and more

Despite FBI reports that crime across the US is declining, many Americans still feel that crime is on the rise. In fact, around 6 out of 10 (61%) respondents to our annual State of Safety survey said they believe crime is increasing—and less than half (48%) said they felt safe in their home state in 2024.

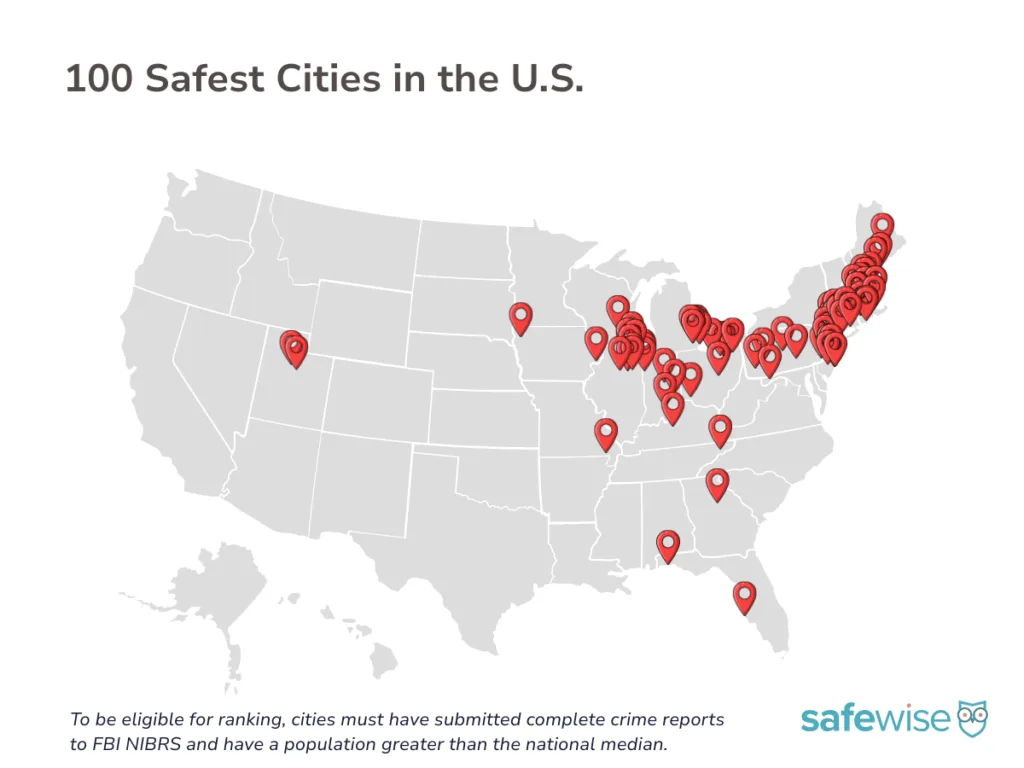
But plenty of cities remain relatively immune to crime trends and headlines that often plague America’s larger metro areas. The 100 cities and towns that made our list this year reported drastically lower per-capita crime rates than nationwide averages, collectively coming in at 0.2 incidents per 1,000 people (on average) for violent crime and a collective average of 2.4 incidents per 1,000 for property crime.

Comparatively, the US violent crime rate, as calculated by our data analyst, is 3.6 incidents per 1,000 people, while the property crime rate is 19.1 incidents per 1,000.

Curious about cities in your state? Check out the safest cities in every state report.

Here are the 10 Safest Cities in America for 2025

See if your city made the full list.

In this report

Breaking down the safest cities: Why crime rates aren't the whole story

Crime rates and other statistics give us a way to measure "safety" across cities, but this data only scratches the surface. Safety can't be broken down by numbers alone, which don't account for things like how secure people feel in their communities, access to resources, and the underlying social and economic conditions that influence crime and safety.

One of the biggest challenges in ranking safe cities is that we rely on self-reported FBI crime data, which only captures certain aspects of public safety. It doesn't reflect issues like racial and economic disparities or even the impact of sudden policy changes—like deportations, or shifts in law enforcement priorities—that can make communities feel more or less safe.

This ranking of the 100 safest cities in the U.S. relies on self-reported crime data from law enforcement agencies across the country. It's the most comprehensive set of data that covers the largest number of cities and towns, but it only uses one dimension of safety. Our intention is to get people thinking about safety, jumpstart conversations, and inspire action in big and small cities, regardless of the per capita crime rate.

Jump to our tips to better evaluate safety in your community and help make a difference.

A closer look at the safest cities in the US

For the purposes of this report, the terms “dangerous” and “safest” refer explicitly to crime rates as calculated from FBI crime data—no other characterization of any community is implied or intended.

While there’s no one thing that indicates if a city will report higher or lower numbers of crimes, we’ve noticed some things that stand out about the 100 cities on our list. Here’s a rundown of some of the most interesting factors we’ve uncovered during our analysis.

Crime insights 

  • The violent crime rate among the safest cities is 0.2 incidents per 1,000 people—that’s 94% lower than the national rate of 3.6.
  • The property crime rate among the safest cities is 2.4 incidents per 1,000—that’s 87% lower than the national rate of 19.1.
  • Only 4 cities reported 10 or more total violent crimes and 17 reported zero.
  • 79% of the cities reported fewer than 50 total property crimes. 
  • 97% of the cities had no murders reported, including the largest cities on the list: Columbus, Indiana; Lexington, Massachusetts; and Zionsville, Indiana.
  • 15 cities reported zero burglaries, and only 1 saw more than 100.
  • 13 of the 100 safest cities are the number one safest city in their state: CO, CT, IL, IN, ME, MA, NJ, NY, OH, RI, TN, UT, and WI.

Demographic insights 

  • Campton Hills is the safest city in the U.S. for 2025, and the safest city in Illinois for the second consecutive year.
  • New Jersey leads the way with 17 cities making the list, the most of any state.
  • 25 states are represented, 1 fewer than last year.
  • The top 3 cities are all from Illinois: Campton Hills, Pingree Grove, and Hawthorn Woods
  • The average population of the safest cities is 14,401—showing that safety isn’t limited to just small towns.
  • Cortland, Ohio, is the smallest city on the list, with a population of 7,048.
  • Columbus, Indiana, is the largest city on the list, with 51,658 residents—significantly larger than most other cities in the top 100.
Curious about crime and safety in your area?
We've got the goods. Sign up for our weekly newsletter emails to get the latest safety news and tips to make your life safer.

By signing up, you agree to our Terms and Conditions and Privacy Policy.

The 100 safest cities in America

VC= Violent crime, PC=Property crime; Crime rates per 1,000 people; Median household income

Campton Hills, IL, the safest city in America for 2025.
#1
Campton Hills, IL
  • Circle Population
    Population
    10,731
  • Circle Dollar
    Median Income
    $192,727
  • Circle Gun
    VC Rate 2025
    0.0
  • Circle Property
    PC Rate 2025
    0.0
Pingree Grove, IL, the second-safest city in America for 2025.
#2
Pingree Grove, IL
  • Circle Population
    Population
    11,370
  • Circle Dollar
    Median Income
    $119,880
  • Circle Gun
    VC Rate 2025
    0.0
  • Circle Property
    PC Rate 2025
    0.8
Great Egrets in Hawthorn Woods, IL, the third-safest city in America for 2025.
#3
Hawthorn Woods, IL
  • Circle Population
    Population
    9,417
  • Circle Dollar
    Median Income
    $238,114
  • Circle Gun
    VC Rate 2025
    0.0
  • Circle Property
    PC Rate 2025
    1.1
Sagamore Hills, OH, the fourth-safest city in America for 2025.
#4
Sagamore Hills, OH
  • Circle Population
    Population
    10,719
  • Circle Dollar
    Median Income
    $100,987
  • Circle Gun
    VC Rate 2025
    0.1
  • Circle Property
    PC Rate 2025
    0.7
#5
Plainfield, CT
  • Circle Population
    Population
    15,227
  • Circle Dollar
    Median Income
    $75,631
  • Circle Gun
    VC Rate 2025
    0.1
  • Circle Property
    PC Rate 2025
    0.5
Indiana Township, PA, the sixth-safest city in America for 2025
#6
Indiana Township, PA
  • Circle Population
    Population
    7,389
  • Circle Dollar
    Median Income
    $123,083
  • Circle Gun
    VC Rate 2025
    0.1
  • Circle Property
    PC Rate 2025
    0.5
#7
Cape Elizabeth, PA
  • Circle Population
    Population
    9,601
  • Circle Dollar
    Median Income
    $145,107
  • Circle Gun
    VC Rate 2025
    0.0
  • Circle Property
    PC Rate 2025
    1.6
Eliot, ME, the eighth-safest city in America for 2025.
#8
Eliot, ME
  • Circle Population
    Population
    7,369
  • Circle Dollar
    Median Income
    $100,472
  • Circle Gun
    VC Rate 2025
    0.0
  • Circle Property
    PC Rate 2025
    1.8
Vernon Township, NJ, 9th safest city in America for 2025.
#9
Vernon Township, NJ
  • Circle Population
    Population
    22,743
  • Circle Dollar
    Median Income
    $113,439
  • Circle Gun
    VC Rate 2025
    0.1
  • Circle Property
    PC Rate 2025
    0.9
Boxford, MA, 10th safest city in America for 2025
#10
Boxford, NJ
  • Circle Population
    Population
    8,103
  • Circle Dollar
    Median Income
    $192,605
  • Circle Gun
    VC Rate 2025
    0.0
  • Circle Property
    PC Rate 2025
    1.9
#11
San Elizario, TX
  • Circle Population
    Population
    10,145
  • Circle Dollar
    Median Income
    $47,946
  • Circle Gun
    VC Rate 2025
    0.1
  • Circle Property
    PC Rate 2025
    1.2
Broadview Heights, OH, 12th safest city in America for 2025.
#12
Broadview Heights, OH
  • Circle Population
    Population
    19,580
  • Circle Dollar
    Median Income
    $99,431
  • Circle Gun
    VC Rate 2025
    0.2
  • Circle Property
    PC Rate 2025
    0.8
#13
Atkinson, NH
  • Circle Population
    Population
    7,427
  • Circle Dollar
    Median Income
    $144,481
  • Circle Gun
    VC Rate 2025
    0.1
  • Circle Property
    PC Rate 2025
    1.1
Lexington, SC, 14th safest city in America for 2025.
#14
Lexington, SC
  • Circle Population
    Population
    25,127
  • Circle Dollar
    Median Income
    $83,263
  • Circle Gun
    VC Rate 2025
    0.2
  • Circle Property
    PC Rate 2025
    1.0
Spring Township, PA, 15th safest city in America for 2025.
#15
Spring Township, PA
  • Circle Population
    Population
    7,999
  • Circle Dollar
    Median Income
    $76,406
  • Circle Gun
    VC Rate 2025
    0.1
  • Circle Property
    PC Rate 2025
    1.3
Bedford Town, NY, 16th safest city in America for 2025.
#16
Bedford Town, NY
  • Circle Population
    Population
    16,700
  • Circle Dollar
    Median Income
    $183,750
  • Circle Gun
    VC Rate 2025
    0.1
  • Circle Property
    PC Rate 2025
    1.3
Shawangunk Town, NY, 17th safest city in America for 2025.
#17
Shawangunk Town, NY
  • Circle Population
    Population
    13,294
  • Circle Dollar
    Median Income
    $105,769
  • Circle Gun
    VC Rate 2025
    0.1
  • Circle Property
    PC Rate 2025
    1.7
Northborough, MA, 18th safest city in America for 2025.
#18
Northborough, MA
  • Circle Population
    Population
    15,694
  • Circle Dollar
    Median Income
    $174,358
  • Circle Gun
    VC Rate 2025
    0.2
  • Circle Property
    PC Rate 2025
    0.9
Weston, CT, 19th safest city in America for 2025.
#19
Weston, CT
  • Circle Population
    Population
    10,373
  • Circle Dollar
    Median Income
    $250,000+
  • Circle Gun
    VC Rate 2025
    0.0
  • Circle Property
    PC Rate 2025
    2.2
Ridgefield, CT, 20th safest city in America for 2025.
#20
Ridgefield, CT
  • Circle Population
    Population
    25,030
  • Circle Dollar
    Median Income
    $143,286
  • Circle Gun
    VC Rate 2025
    0.0
  • Circle Property
    PC Rate 2025
    2.0
Bell
Want to see the rest of the list?

Still hoping to see your town in the top 100? Take a look at the rest of the safest cities in America below.

Get involved: Tips to help you research the safety of your community

Whether or not your city ranks high or low for per capita crime rates, there's a lot you can do to get a better grasp on how safe your neck of the woods really is. Stop wondering and start learning with these tips to find out more about what's happening in your neighborhood or city and how you can get involved.

  • Take a look outside: Paying attention to your street or neighborhood can tell you a lot. Some things to look for that can make a neighborhood safer include: street lighting, safe walking and biking paths/lanes, access to emergency services, fire hydrants, clean sidewalks, roads, and parks.
  • Check out online tools: There are safety apps and websites that offer things like real-time crime data and neighbor-shared concerns. These apps and sites also offer community resources for public safety, emergency responders, community programs and education, and other risks like natural disasters.
  • Get involved with your community: Talk to neighbors, go to city council and school board meetings, and keep an eye on local and national policies that can impact your safety. Learn about how budgets (is public safety funded adequately?) and community resources can contribute to or detract from safety trends and security. Join or start neighborhood safety programs to advocate for things like better street lighting, safer sidewalks during winter months, etc.

Didn't find your city in the top 20?

We calculated crime rates for every city in the country that submitted complete crime reports and met our population threshold. See how the remaining cities ranked in the list below. 

NOTE: If you don’t see your city on the list, it means that it was below the population threshold or didn’t submit a complete crime report to the FBI in the last year for which complete data was available at time of publication.

National Rank
Agency Name
State
Population
Violent crime rate Icon Tooltip  Dark
Property crime rate Icon Tooltip  Dark
21Bernards TownshipNew Jersey28,1510.02.3
22Mount HorebWisconsin7,6410.11.4
23ClintonMassachusetts15,5760.30.6
24ColumbusIndiana51,6580.21.1
25BrookfieldIllinois18,4700.30.2
26WolcottConnecticut16,2340.02.6
27GilbertsIllinois8,7560.11.8
28Olmsted TownshipOhio14,4710.12.2
29WaylandMassachusetts13,5970.12.4
30WaldwickNew Jersey10,0670.12.2
31Park RidgeNew Jersey9,7610.12.3
32St. JohnIndiana24,1100.21.9
33EmersonNew Jersey7,2400.12.1
34DouglasGeorgia11,6770.03.2
35Western SpringsIllinois13,1720.12.7
36PiedmontOklahoma8,9700.03.2
37Cecil TownshipPennsylvania15,0790.21.9
38WanaqueNew Jersey10,9620.22.1
39Ocean PinesMaryland11,7080.22.2
40OradellNew Jersey8,1670.12.6
41LitchfieldNew Hampshire8,5370.21.9
42Signal MountainTennessee8,8960.03.5
43DyerIndiana16,2920.12.8
44OronoMaine11,2960.22.4
45CorcoranMinnesota8,0170.41.1
46ScituateRhode Island10,4570.31.7
47Lone PeakUtah30,4910.12.8
48South Londonderry TownshipPennsylvania8,8310.12.9
49Sparta TownshipNew Jersey20,3210.13.1
50Sioux CenterIowa8,5170.12.9
51NolensvilleTennessee18,4500.22.3
52BristolRhode Island22,0240.22.6
53KinnelonNew Jersey10,0410.03.9
54MillisMassachusetts9,0600.40.9
55Hinckley TownshipOhio8,1180.13.1
56Homer GlenIllinois24,4170.22.8
57CresskillNew Jersey9,0780.13.2
58Montville TownshipOhio13,3090.22.9
59GrotonMassachusetts11,1440.32.2
60"Ocean Township, Ocean County"New Jersey9,1400.22.5
61GypsumColorado9,4220.22.7
62CumberlandMaine8,6640.22.5
63Denville TownshipNew Jersey17,2140.04.2
64HollisNew Hampshire8,8650.13.5
65HinsdaleIllinois17,1660.13.5
66ZionsvilleIndiana32,5730.22.9
67South Lake MinnetonkaMinnesota12,1500.23.3
68Cottage GroveWisconsin9,8030.41.6
69ChestertonIndiana14,6990.32.2
70Spring Arbor TownshipMichigan8,4790.22.9
71HopkintonRhode Island8,4490.23.0
72Pompton LakesNew Jersey10,8510.14.0
73"Washington Township, Bergen County"New Jersey9,2540.32.4
74River Vale TownshipNew Jersey9,9260.23.2
75ReddingConnecticut8,7540.13.9
76SharonMassachusetts18,4490.32.8
77BernardsvilleNew Jersey7,9000.04.7
78Avon LakeOhio25,7890.14.2
79North RoyaltonOhio30,6830.23.2
80BerkleyMichigan14,8630.04.8
81BlackstoneMassachusetts9,2570.51.1
82DavidsonNorth Carolina16,0890.23.5
83HampshireIllinois7,8990.42.3
84Genoa TownshipOhio27,3490.14.4
85Hobart-LawrenceWisconsin17,3850.32.9
86MedwayMassachusetts13,6300.23.4
87MiddletonMassachusetts9,9830.32.9
88CortlandOhio7,0480.05.0
89MillikenColorado9,4050.14.3
90BatesvilleIndiana7,3300.42.2
91FulshearTexas25,5790.23.9
92GlocesterRhode Island10,2070.42.4
93La SalleIllinois9,3530.51.4
94BarringtonRhode Island17,1490.14.3
95Lake in the HillsIllinois28,5880.32.7
96Hamburg TownshipMichigan21,3920.61.2
97RichmondRhode Island8,2160.23.4
98Mount Olive TownshipNew Jersey29,1600.23.7
99RolesvilleNorth Carolina11,1490.23.9
100LexingtonMassachusetts34,0440.33.1

How we ranked the safest cities in America

To identify the 100 safest cities in the country, we analyzed FBI and NIBRS crime report statistics and population data. The FBI data is for crimes reported in 2023 (the most recent year for which complete data was available as of publication). Our rankings were based solely on per capita crime data; no other factors were included.

Population thresholds 

We established a minimum population threshold equal to the median population of all cities that submitted complete crime reports. Cities that fell below the population threshold and those that failed to submit a complete crime report to the FBI were excluded.

Crime rates 

Our rankings are based on both violent and property crime numbers. We looked at the number of reported violent crimes (aggravated assault, murder, rape, and robbery) in each city and the number of reported property crimes (burglary, larceny-theft, and motor vehicle theft).

Arson is excluded from the FBI’s property crime rates, so we excluded it as well.

To level the playing field, we calculated the rate of crimes per 1,000 people in each city. This makes it easier to directly compare the likelihood of these crimes occurring in cities with vastly different populations. (By comparison, the FBI uses the number of crimes per 100,000 people to calculate its rates.)

Both violent and property crime numbers were weighted equally. That means that a city with no violent crimes reported could end up lower on the list due to a higher property crime rate, and vice versa. We also standardized violent and property crime for each state before weighting.

Consult our full methodology to learn more about how we rank the Safest Cities.

How to make a safe home anywhere

Over 6 in 10 Americans surveyed don't have a home security system, despite over 50% of all burglaries being residential. Unfortunately, a majority of people who have a security system added it after they had a break-in. One of the best ways to stop a burglary before it happens—and get immediate help if a break-in is detected—is to add a monitored home security system.

Light Bulb
Get a home security system

Find out which companies we recommend for every budget and lifestyle in our roundup of the best home security yystems—and learn the basics with our guide on Everything You Need to Know About Home Security

Find security and safety resources in your area

Find the safest cities in each state

Click on the state image or dropdown menu below to check out the safest cities for each state.

Related articles on SafeWise


Sources

FBI Crime Data Explorer, "Documents & Downloads." Accessed March 21, 2025. 

  • 2023 Crime in the United States Annual Reports
    • Offenses Known to Law Enforcement
  • 2023 NIBRS Estimation Tables

Bureau of Justice Statistics, "National Incident-Based Reporting System (NIBRS)." Accessed March 21, 2025.

US Census Bureau, “QuickFacts,” Accessed March 21, 2025.

Rebecca Edwards
Written by
Rebecca is the Managing Editor and lead safety expert at SafeWise.com, where she's been researching, testing, and writing about home and personal security for over 12 years. Her safety smarts come from both real life and professional experience—as a single parent trying out safety and security gadgets to protect her family and a former college director responsible for safety plans and strategies to keep buildings, grounds, and hundreds of students and faculty safe every day. With 30 years of experience as a journalist and blogger, she's become a go-to source for trustworthy, practical advice on everything from the best home security systems and smart gadgets to keeping kids safe online, preventing package theft, and understanding crime trends nationwide. PBS NewsHour, The Today Show, NPR, Vice, TechCrunch, The Washington Post, HGTV, Marketplace, On the House, and more have featured Rebecca's expert insights and recommendations. Whether it's protecting your home, your loved ones, or your peace of mind, Rebecca makes safety simple, doable, and real.

Recent Articles

woman talking on phone
How to Cancel SimpliSafe
SimpliSafe doesn’t charge any cancellation fees or make you jump through hoops to stop service....
Cove security system panel in box and yard sign in box
Cove Home Security System Review 2025
Cove DIY home security stands out with customer-first practices and extensive alarm response options to...
sensor light on a residential building
Best Motion Detector Lights of 2025
Check out our round-up of the top five best motion sensor lights of 2025 with...
Man and woman couple wife husband set up surveillance security camera
Best Apartment Security Systems of 2025
SimpliSafe is the best apartment security system with no contracts, wireless equipment, and affordable or...