Package Theft and Cybercrime Are Now the Most Common Crimes in America

State of Safety Special Analysis

years of comparative data
7
Americans surveyed per state
100
total responses per year
5,000
questions fielded in 2025
34

When Americans think about crime, they tend to picture the most extreme scenarios — violent assaults, gun violence, and the kinds of incidents that dominate national headlines. But those crimes, while serious, aren’t what most people actually experience.

Instead, the most common crimes in America are far more routine — and far more widespread. According to SafeWise State of Safety survey data, more than a third of Americans report experiencing package theft or cybercrime, far outpacing violent crime.

That gap between perception and reality reveals something important: the crimes shaping everyday life in America don’t look like the ones leading the news cycle. And that mismatch is changing how people think about safety — and how they try to protect themselves.

The most common crimes Americans experience today

The data paints a clear — and somewhat surprising — picture of crime in America. Today, the most common experiences aren’t violent incidents, but everyday disruptions tied to modern life:

  • 37% of Americans report experiencing package theft
  • 33% report experiencing cybercrime
  • 27% report experiencing property crime
  • 14% report experiencing violent crime

In other words, Americans are more than twice as likely to deal with stolen deliveries or online scams than with violent crime.

This reflects a broader shift in where and how crime happens. As more of daily life moves online—and more goods are delivered directly to people’s homes—crime has followed.

Instead of isolated, high-profile incidents, many Americans now face:

  • Repeated package thefts from their doorstep
  • Ongoing scam attempts or fraud
  • Account breaches and digital theft

These aren’t one-time events. They’re recurring, low-level disruptions that affect millions of people — and often happen multiple times a year.

Notepad
Package theft is one of the most common crimes Americans experience.

For a deeper look at how it affects households, retailers, and communities, see SafeWise’s latest Porch Pirates report.

The states where people reported the most (and least) experiences with package theft

This map shows the states with the most and fewest reported package theft incidents in the 2026 State of Safety Survey. Red/pink states reported the most, and the blue states reported the fewest. Image: SafeWise

Package theft is now a routine part of daily life

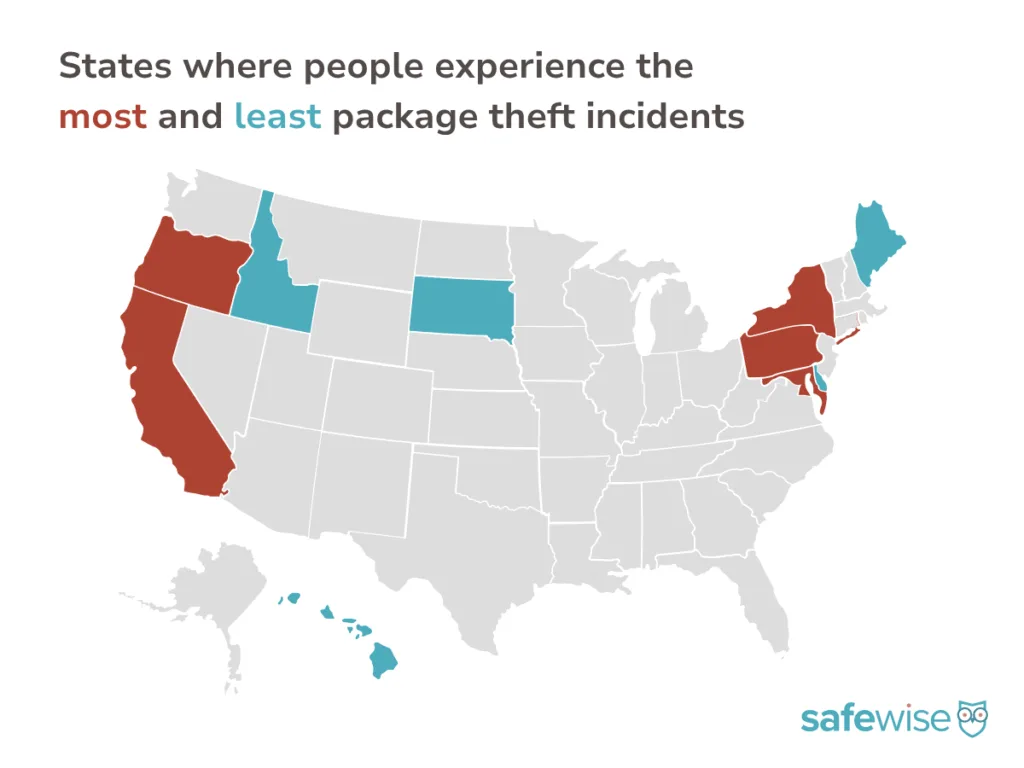
For many Americans, package theft isn’t a rare event — it’s something they’ve come to expect.

According to our most recent data, 37% of Americans report experiencing package theft, making it one of the most common forms of crime in the country.

In some states, the problem is even more widespread. Nearly half of Washington residents (48%) report experiencing package theft, followed closely by New Mexico and Colorado (47% each).

At the other end of the spectrum, states like Vermont (29%) and South Dakota (30%) report significantly lower rates — but even there, nearly 1 in 3 residents have dealt with stolen deliveries.

What makes package theft unique is how normalized it has become:

  • Deliveries are frequent and often left unattended
  • Incidents are rarely reported or recovered
  • Many victims experience it more than once

As a result, package theft isn’t just a crime — it’s a recurring friction point in everyday life, especially as e-commerce continues to grow.

The states where people reported the most (and least) experiences with cybercrime

This map shows where people reported the most personal incidents of cybercrime. The red/pink states report the most, and the blue states report the fewest. Image: SafeWise

Cybercrime has become a widespread, everyday threat

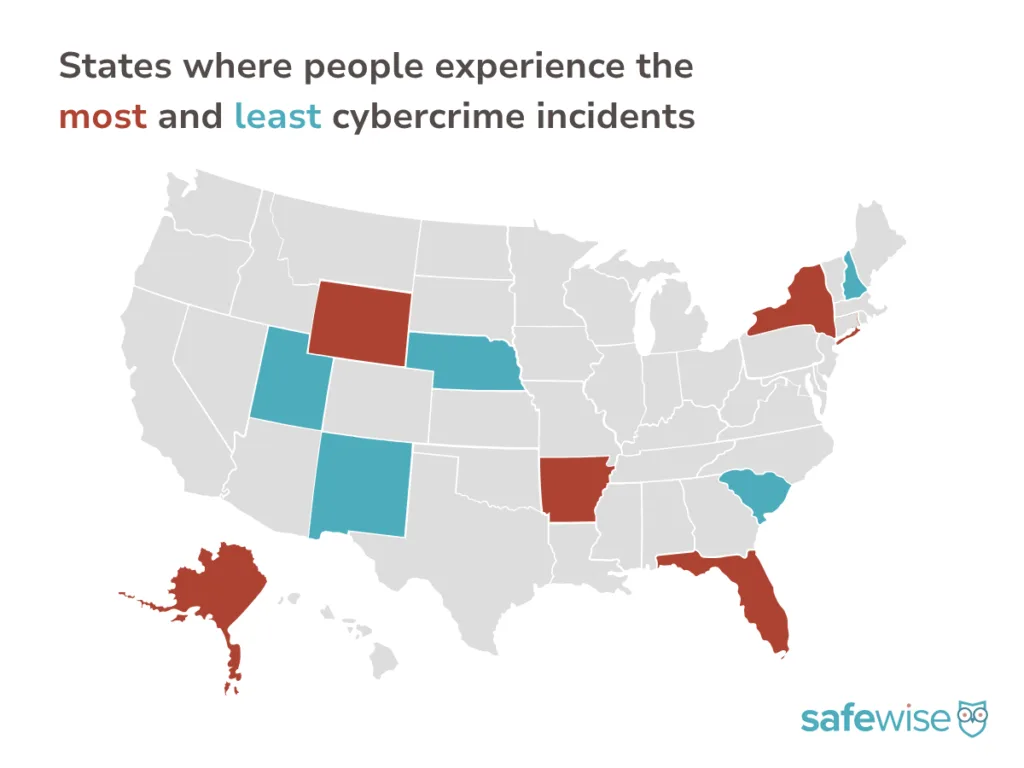
If package theft reflects how crime has moved to the doorstep, cybercrime shows how it has moved fully online.

Today, 33% of Americans report experiencing cybercrime, from scams and fraud to account breaches and identity theft.

In some states, the impact is even more pronounced:

  • Utah leads the nation at 48%
  • Kansas and Wyoming follow at 44%
  • Several other states report rates above 40%

Meanwhile, states like South Carolina and Texas (23%) report lower — but still significant — levels of cybercrime exposure.

Unlike traditional crime, cybercrime:

  • Can happen anywhere, regardless of location
  • Often targets the same individuals repeatedly
  • Is frequently underreported

And because it happens digitally, it can feel less visible — even as it affects a growing share of the population.

The result is a new kind of risk landscape, where crime is constant, distributed, and increasingly tied to how people live, shop, and connect online.

Why everyday crime still gets overlooked

If these crimes are so widespread, why don’t they dominate the national conversation?

Because attention doesn’t follow frequency — it follows severity.

Violent crimes are less common, but they’re:

  • More dangerous
  • More emotionally charged
  • More likely to generate sustained media coverage

Meanwhile, the most common crimes — like package theft and cybercrime — are:

  • Non-violent
  • Often underreported
  • Spread across millions of smaller incidents

That makes them easy to overlook, even as they affect a growing share of Americans.

There’s also a tracking problem. Many everyday crimes fall into gray areas:

  • Package theft isn’t consistently reported or categorized — it gets lumped in with larceny-theft (if it's recorded at all)
  • Cybercrime often goes unreported or is handled outside traditional law enforcement
  • Repeat incidents blur into the background of daily life

The result is a distorted perception of risk — where the crimes people fear most aren’t always the ones they’re most likely to experience.


From rankings to real-world safety

Our Safest Cities rankings help highlight crime incidence patterns and relative risk — but they don’t determine what happens in a community or a home. How safe a community is (or isn't) is the result of a mix of individual choices, community conditions, and external factors like the economy, job market, housing availability, and local priorities.

Expand the sections below for a closer look at what you can do to help improve the safety of your community.

It's not possible to eliminate risk entirely, but you can reduce your potential risk by staying informed about local crime trends, practicing situational awareness (know who belongs in your neighborhood, work parking lot, etc.), and taking practical steps to protect yourself and your property.

Getting involved in your community can make a big difference — but you should expect certain baseline crime prevention measures from your neighborhood and city.

  • Good lighting in public spaces
  • Visible community law enforcement presence
  • Neighborhood watch-type groups/support
  • Access to a community liasion officer or department
  • Budget to support community safety programs (beyond law enforcement)

Strong local networks — whether formal or informal (or in-person or virtual) — can play an essential role in improving safety beyond what statistics alone can capture.

Our research and national crime data consistently point to the value of layered prevention. This means that the more layers you put between your home and loved ones and criminals, the better chance you have of actually deterring a criminal act.

Multiple security layers can look like a neighborhood watch plan combined with locking your doors when you leave the house, and a security camera with a siren that can scare an intruder away. A monitored security system that connects you to faster help if something happens adds an extra proactive layer.

Research-backed practices that help reduce exposure include:

  • Community prevention: Improved lighting, clear sightlines (trim hedges and bushes near doors/windows), and coordinated neighborhood efforts
  • Awareness and reporting: Stay alert, trust your instincts, know who and what belongs in your neighborhood, and report suspicious behavior
  • Home safety fundamentals: Secure all entry points (don't forget the deck or the sliding glass door), eliminate hiding spots around your home, and get into consistent security routines (locking the door, arming the security system)
  • Targeted technology use: Pair common-sense safety habits with tools that support awareness or response, like monitored security systems or cameras

Find the safest cities in each state

Click on the state below to check out the safest cities for each state.

How we determine and interpret these rankings

Our Safest Cities rankings offer a data-informed look at crime trends across cities. They’re designed to highlight relative risk — not to define overall quality of life or what it’s like to live in a community.

We use the most recent FBI-reported violent and property crime data, and adjust for population so we can compare cities of different sizes fairly. This approach helps us identify patterns and differences in reported crime rates.

Our analysis includes only crime data from agencies that submitted complete reports to the FBI through the National Incident-Based Reporting System (NIBRS). We do not estimate crime totals for agencies with incomplete reporting, so our findings and crime rate trends may differ from reports that include estimated national crime data.

We understand that crime statistics reported to one source don’t tell the whole story. A number of factors, including local agency reporting practices, community resources, prevention efforts, and lived experience all influence how safe a place is (or is perceived to be) — and not all of that shows up in the numbers.

Think of these rankings as a starting point. Our goal is to help readers understand crime trends and ask informed questions, not to judge communities or the people who call them home.

Learn how we identified the safest cities on our methodology page.

Get a deeper understanding of our independent research, data sources, calculations, and how we refine our reports each year.

Find all endnotes and sources in our full methodology.

FBI Crime Data Explorer, "Documents & Downloads." 

  • 2024 Crime in the United States Annual Reports
    • Offenses Known to Law Enforcement
  • 2024 NIBRS Estimation Tables

Bureau of Justice Statistics, "National Incident-Based Reporting System (NIBRS)." 

Gun Violence Archive, "Mass Shootings." 

Safest Cities Badges:
Safest Cities badges are available at no charge for use by law enforcement agencies and city government. City government and law enforcement representatives should contact [email protected]
to inquire about badge usage.

To request a badge:

  • Please put "Safest Cities badge request" in your subject line
  • Include the name of your city and state
  • Share the city government or law enforcement agency you represent

Badges are also available for licensing by other entities, including tourism boards, local businesses, and similar organizations. All other interested parties should contact our official partner, Wright’s Media, for information on available usages, license fees, and award seal artwork at [email protected].