10 U.S. Metros With Improving Crime Rates

For over 13 years, SafeWise experts have conducted independent research and testing to write unbiased, human reviews (not robots). Learn more.

Cathy Habas
Mar 12, 2026
Icon Time To Read3 min read

Cathy has been a SafeWise contributor since 2021, helping turn crime data into clear, useful safety insights.

Each year, SafeWise analyses the latest FBI crime data for thousands of U.S. cities. We assign unique, weighted safety scores to rank the Safest Cities in America.

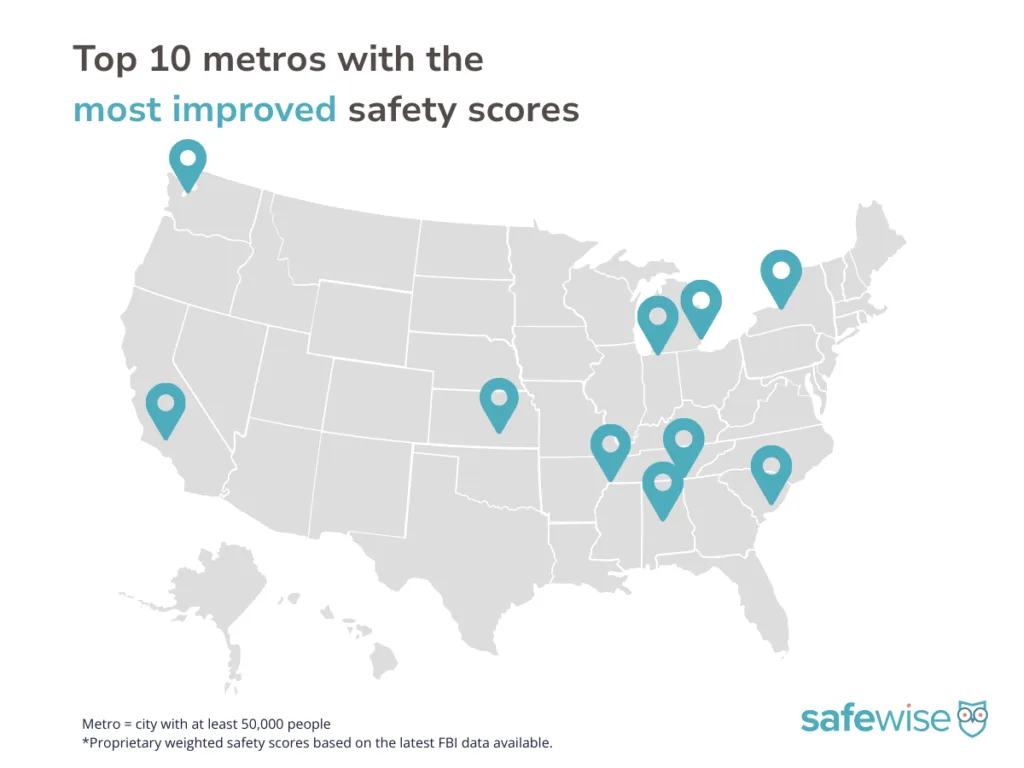
In 2026, we also started celebrating cities with the most improved safety scores. These communities don't necessarily have the lowest crime rates, but they've seen remarkable improvements in a short period of time. That progress is often hard-won and deserves a moment in the spotlight. 

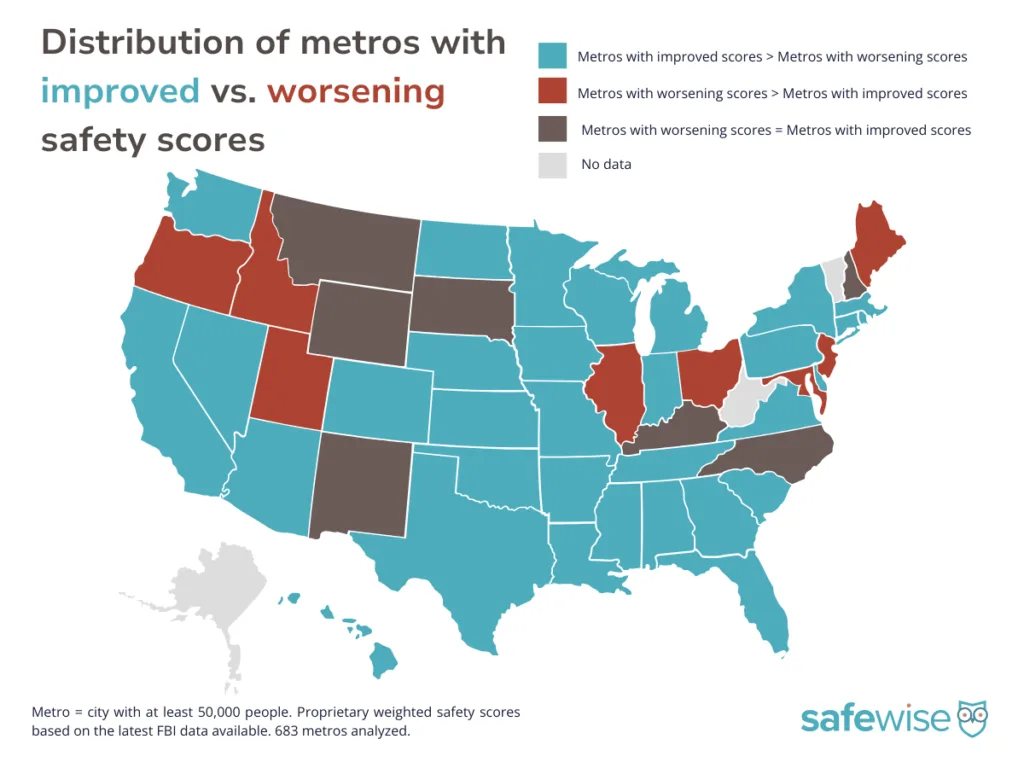
In this report, we narrowed our population criteria to only look at metros (cities with a population ≥50,000). More than 680 metros reported crime data to the FBI for two years in a row. Which ones improved the most? Let's take a look. 

Here are the top 10 metros with improved safety scores

Looking for smaller cities? Check our companion report: 20 Cities With the Most Improved Safety Scores

A map of the 10 U.S. metros with the most improved safety scores, according to the latest FBI data. Image: SafeWise


National crime trends: Holding steady in metros

  •  The average U.S. metro saw a slight improvement in its safety score (0.4 points).
  • Violent crime rates tended to increase across U.S. metros while property crime rates decreased. 
  • In the 2026 reporting year, the average U.S. metro had a violent crime rate of 2.8 incidents per 1,000 people and a property crime rate of 17.2 incidents per 1,000 people. 
  • More than 92 million people live in a metro with an improved safety score. More than 70 million live in a metro with a worsening safety score. 
  • Nashville, TN was the only metro to achieve the same safety score year over year. 

A distribution map of metros with improved vs. worsening safety scores. Image: SafeWise


The top 10 metros with the most improved safety scores

VC = Violent crime; PC = Property crime; Crime rates per 1,000 people

#1
Wichita, KS
(
17.8 points
Up
)
  • Circle Population
    Population
    395,486
  • Circle Gun
    VC Rate 2026, 2025
    5.4, 11.2 (52%↓)
  • Circle Property
    PC Rate 2026, 2025
    23.2, 47.9 (51%↓)
#2
Bakersfield, CA
(
8.9 points
Up
)
  • Circle Population
    Population
    416,120
  • Circle Gun
    VC Rate 2026, 2025
    5.4, 11.2 (38%↓)
  • Circle Property
    PC Rate 2026, 2025
    24.2, 34.0 (29%↓)
#3
Memphis, TN
(
8.7 points
Up
)
  • Circle Population
    Population
    613,207
  • Circle Gun
    VC Rate 2026, 2025
    25.5, 26.6 (4%↓)
  • Circle Property
    PC Rate 2026, 2025
    69.9, 87.2 (20%↓)
#4
Tacoma, WA
(
7.7 points
Up
)
  • Circle Population
    Population
    223,980
  • Circle Gun
    VC Rate 2026, 2025
    10.8, 12.8 (15%↓)
  • Circle Property
    PC Rate 2026, 2025
    57.2, 73.7 (22%↓)
#5
Detroit, MI
(
7.6 points
Up
)
  • Circle Population
    Population
    651,171
  • Circle Gun
    VC Rate 2026, 2025
    17.7, 20.3 (13%↓)
  • Circle Property
    PC Rate 2026, 2025
    43.7, 48.3 (9%↓)
#6
Birmingham, AL
(
7.6 points
Up
)
  • Circle Population
    Population
    195,418
  • Circle Gun
    VC Rate 2026, 2025
    12.5, 15.5 (19%↓)
  • Circle Property
    PC Rate 2026, 2025
    41.0, 45.9 (11%↓)
#7
Chattanooga, TN
(
7.3 points
Up
)
  • Circle Population
    Population
    188,894
  • Circle Gun
    VC Rate 2026, 2025
    8.2, 10.9 (25%↓)
  • Circle Property
    PC Rate 2026, 2025
    39.5, 48.8 (19%↓)
#8
Summerville, SC
(
7.3 points
Up
)
  • Circle Population
    Population
    52,148
  • Circle Gun
    VC Rate 2026, 2025
    2.2, 4.3 (49%↓)
  • Circle Property
    PC Rate 2026, 2025
    18.2, 31.8 (43%↓)
#9
Rochester, NY
(
7.1 points
Up
)
  • Circle Population
    Population
    206,093
  • Circle Gun
    VC Rate 2026, 2025
    5.9, 7.3 (19%↓)
  • Circle Property
    PC Rate 2026, 2025
    36.0, 54.4 (34%↓)
#10
South Bend, IN
(
6.8 points
Up
)
  • Circle Population
    Population
    103,415
  • Circle Gun
    VC Rate 2026, 2025
    9.6, 12.0 (19%↓)
  • Circle Property
    PC Rate 2026, 2025
    20.9, 26.2 (20%↓)

A closer look at the 10 U.S. metros with the most improved safety scores

For the purposes of this report, the terms “dangerous” and “safest” refer explicitly to crime rates as calculated from FBI crime data—no other characterization of any community is implied or intended.

  • 683 metropolitan cities qualified for ranking.
  • Notable metros that didn't qualify for our list include Los Angeles, CA; Phoenix, AZ; and Jacksonville, FL. These cities didn't report data to the FBI in the last two years.
  • No metros from Alaska, Vermont, or West Virginia reported data to the FBI in the last two years. 
  • Property crime rate: Wichita, KS saw a 51% decrease in property crime year over year, which is the largest percentage of any U.S. metro. Summerville, SC reported the second most improved property crime rate at 43%. 
  • Violent crime rate: Wichita and Summerville also lead the way with the largest percentage decreases in violent crime among the top 10 metros (52% in Wichita and 49% in Summerville).
  • Aggravated assault: Wichita reported the largest decrease in the number of aggravated assaults in any U.S. metro, falling from 3,699 to 1,793. That's a 51.5% decrease in one year. 
  • Murder: Memphis, TN reported the largest decrease in the number of murders in the 10 most improved metros (351 to 249 — a difference of 102). Only Philadelphia, PA saw a larger decrease (difference of 141). 
  • Rape: Of the top 10 most improved metros, Wichita reported the largest decrease in the number of rapes, dropping from 290 to 99. That's a difference of 191 and a 66% decrease. Of all metros, El Paso, TX reported the most significant decline in rape, dropping from 240 to 1. 
  • Robbery: Memphis saw the largest drop in the number of reported robberies (2,797 to 2,163 — a difference of 634). Wichita saw the largest percentage decrease at 52% (414 incidents to 198). Among all metros, Chicago, IL saw the largest decrease in the number of robberies (a difference of 1,987 incidents).
  • Burglary: Memphis reported the largest decrease in the number of burglaries among all metros (6,751 to 5,441 — a difference of 1,310). Wichita saw the second largest decrease among all metros (2,213 to 1,037 — a difference of 1,176) and the largest percentage decrease (53%) among the top 10. 
  • Larceny theft: Wichita cut its larceny theft rate by 51%, which is the highest percentage among all metros. That translates to 7,462 fewer incidents in the city, the largest number gap among all metros. 
  • Motor vehicle theft: Summerville reported the most significant percentage decrease in motor vehicle thefts among the top 10 metros at 65%, followed by Rochester, NY at 53.9%. However, Memphis reported the largest drop in the number of motor vehicle thefts among the top 10 (15,819 to 9,836 — a difference of 5,983). That's the third largest decrease behind Philadelphia (8,041 fewer) and San Antonio, TX (6,425 fewer). 

How we measure improvement

This ranking is based on the same FBI crime data used in our annual Safest Cities report. We evaluate both violent crime (aggravated assault, robbery, rape, and murder) and property crime (burglary, larceny-theft, and motor vehicle theft), calculating rates per 1,000 residents to allow for fair comparisons across cities of different sizes.

For the Most Improved Metros list, we analyzed year-over-year changes in those standardized rates and identified the cities that achieved the largest overall increase in their weighted safety scores.

Cities included in the analysis:

  • Met minimum population thresholds (50,000 or more)
  • Submitted complete crime data to the FBI for the last two years
  • Qualified under our standardized scoring methodology

Violent and property crimes are weighted equally in our scoring model. Cities are ranked based on the magnitude of their improvement — not by having the lowest crime rate overall.

This distinction is important. A city can rank among the most improved even if it does not yet rank among the safest in its state. What matters here is measurable progress.

From rankings to real-world safety

Our Safest Cities rankings help highlight crime incidence patterns and relative risk — but they don’t determine what happens in a community or a home. How safe a community is (or isn't) is the result of a mix of individual choices, community conditions, and external factors like the economy, job market, housing availability, and local priorities.

Expand the sections below for a closer look at what you can do to help improve the safety of your community.

It's not possible to eliminate risk entirely, but you can reduce your potential risk by staying informed about local crime trends, practicing situational awareness (know who belongs in your neighborhood, work parking lot, etc.), and taking practical steps to protect yourself and your property.

Getting involved in your community can make a big difference — but you should expect certain baseline crime prevention measures from your neighborhood and city.

  • Good lighting in public spaces
  • Visible community law enforcement presence
  • Neighborhood watch-type groups/support
  • Access to a community liasion officer or department
  • Budget to support community safety programs (beyond law enforcement)

Strong local networks — whether formal or informal (or in-person or virtual) — can play an essential role in improving safety beyond what statistics alone can capture.

Our research and national crime data consistently point to the value of layered prevention. This means that the more layers you put between your home and loved ones and criminals, the better chance you have of actually deterring a criminal act.

Multiple security layers can look like a neighborhood watch plan combined with locking your doors when you leave the house, and a security camera with a siren that can scare an intruder away. A monitored security system that connects you to faster help if something happens adds an extra proactive layer.

Research-backed practices that help reduce exposure include:

  • Community prevention: Improved lighting, clear sightlines (trim hedges and bushes near doors/windows), and coordinated neighborhood efforts
  • Awareness and reporting: Stay alert, trust your instincts, know who and what belongs in your neighborhood, and report suspicious behavior
  • Home safety fundamentals: Secure all entry points (don't forget the deck or the sliding glass door), eliminate hiding spots around your home, and get into consistent security routines (locking the door, arming the security system)
  • Targeted technology use: Pair common-sense safety habits with tools that support awareness or response, like monitored security systems or cameras

Find the safest cities in each state

Click on the state below to check out the safest cities for each state.

How we determine and interpret these rankings

Our Safest Cities rankings offer a data-informed look at crime trends across cities. They’re designed to highlight relative risk — not to define overall quality of life or what it’s like to live in a community.

We use the most recent FBI-reported violent and property crime data, and adjust for population so we can compare cities of different sizes fairly. This approach helps us identify patterns and differences in reported crime rates.

Our analysis includes only crime data from agencies that submitted complete reports to the FBI through the National Incident-Based Reporting System (NIBRS). We do not estimate crime totals for agencies with incomplete reporting, so our findings and crime rate trends may differ from reports that include estimated national crime data.

We understand that crime statistics reported to one source don’t tell the whole story. A number of factors, including local agency reporting practices, community resources, prevention efforts, and lived experience all influence how safe a place is (or is perceived to be) — and not all of that shows up in the numbers.

Think of these rankings as a starting point. Our goal is to help readers understand crime trends and ask informed questions, not to judge communities or the people who call them home.

Learn how we identified the safest cities on our methodology page.

Get a deeper understanding of our independent research, data sources, calculations, and how we refine our reports each year.

Find all endnotes and sources in our full methodology.

FBI Crime Data Explorer, "Documents & Downloads." 

  • 2024 Crime in the United States Annual Reports
    • Offenses Known to Law Enforcement
  • 2024 NIBRS Estimation Tables

Bureau of Justice Statistics, "National Incident-Based Reporting System (NIBRS)." 

Gun Violence Archive, "Mass Shootings." 

Safest Cities Badges:
Safest Cities badges are available at no charge for use by law enforcement agencies and city government. City government and law enforcement representatives should contact [email protected]
to inquire about badge usage.

To request a badge:

  • Please put "Safest Cities badge request" in your subject line
  • Include the name of your city and state
  • Share the city government or law enforcement agency you represent

Badges are also available for licensing by other entities, including tourism boards, local businesses, and similar organizations. All other interested parties should contact our official partner, Wright’s Media, for information on available usages, license fees, and award seal artwork at [email protected].

Cathy Habas
Written by
With over 12 years of experience as a content writer, Cathy has a knack for untangling complex information. Her natural curiosity and ability to empathize help Cathy offer insightful, friendly advice. She believes in empowering readers who may not feel confident about a purchase, project, or topic. Cathy earned her Bachelor of Arts degree in English from Indiana University Southeast and began her professional writing career immediately after graduation. She is a certified Safe Sleep Ambassador and has contributed to sites like Safety.com, Reviews.com, Hunker, and Thumbtack. Cathy’s pride and joy is her Appaloosa “Chacos.” She also likes to crochet while watching stand-up comedy specials on Netflix.

Recent Articles

A photo of our testing of the SimpliSafe home security system.
7 Best Home Security Systems of 2026 | Reviewed and Tested by Experts
Looking for the best home security systems of 2026? Our expert test and rank SimpliSafe...
Child using smartwatch with location indicated on a map.
What Is Geofencing, and Does It Work?
Learn how geofencing on kids smartwatches really works, including GPS accuracy limits, boundary sizes, notification...
mSpy Review — Is This Parental Control Software Right for You?
mSpy is a parental control app with powerful features, but is it the best solution...
kids blowing bubbles
Verizon Gizmo Watch Review
Our child safety expert compares the Verizon Gizmo Watch 3 and Gizmo Watch 3 Adventure....