How Safe Are U.S. Border Cities?

Think Border Cities Are Dangerous? The Data Tells a Different Story

For over 13 years, SafeWise experts have conducted independent research and testing to write unbiased, human reviews (not robots). Learn more.

Cathy Habas
Mar 17, 2026
Icon Time To Read4 min read
Icon CheckEdited ByRebecca Edwards

Cathy has been a SafeWise contributor since 2021, helping turn crime data into clear, useful safety insights.

Border communities are often associated with higher crime due to drug trafficking, human smuggling, and cross-border activity. But what does the data actually say?

Using the latest FBI crime data, we analyzed cities within 60 miles of the U.S.-Mexico and U.S.-Canada borders to understand how crime rates compare — and which communities stand out as the safest.

The results challenge common assumptions: many border cities are just as safe — or safer — than the average U.S. city.

Icon Light Bulb  Dark
Key findings
  • Border cities report lower violent crime than the national average. The average violent crime rate in border cities is 3.7 incidents per 1,000 people, compared to 4.43 nationwide.
  • Property crime is also lower in border cities. Border cities average 19 property crimes per 1,000 people, versus 22.89 nationally.
  • Northern border cities aren’t always safer. Cities along the U.S.-Canada border tend to have higher property crime rates than those along the U.S.-Mexico border.
  • Proximity to the southern border doesn’t increase crime. Crime rates remain steady — or even decrease —t he closer cities are to the U.S.–Mexico border.
  • Most border cities report very low rates of serious violent crime. A majority reported zero murders in the most recent FBI data year.

Here are the top 10 safest border cities (within 60 miles of an international border)

See where your city landed on the full list of cities within 60 miles of an international border.

Northern border cities report higher crime rates (on average) than southern border cities. Image: SafeWise


Border city crime rates vs. nationwide crime rates

Among all of the border cities — both north and south — the average violent crime rate is 3.7 incidents per 1,000 people. That's lower than the national average of 4.43. The average violent crime rate in border cities didn't change year over year.

The average property crime rate among all border cities is 19 incidents per 1,000 people, which is lower than the national average of 22.89. Border cities saw an average decline of 10.5% in property crime year over year.

The averages tell just one side of the story. In reality, crime rates vary widely from city to city.    

Lowest
Highest
Border city average
Nationwide average
Violent crime rate0.2 (Sedro-Woolley, WA and Potsdam Village, NY)29.8 (Highland Park, MI)3.74.43
Property crime rate1.8 (Imperial, CA)60.8 (Burlington, WA) 1922.89

Although average crime rates are relatively low in border cities, there's considerable variation from city to city. Crime rates = incidents per 1,000 people


Crime along the northern border vs. the southern border

Cities within 60 miles of the U.S.-Mexico border report different crime rates and trends compared to cities within 60 miles of the U.S.-Canada border. Here's what the data shows:

  • Cities along the U.S.-Canada border have higher average violent crime rates and property crime rates than cities along the U.S.-Mexico border.
  • U.S.-Mexico border cities saw a larger decline in property crime than U.S.-Canada border cities.
  • Aggravated assault and burglary are slightly more common in northern border cities.
  • Larceny-theft and motor vehicle theft are slightly more common in southern border cities.
  • Murder and rape occur at nearly the same rate in both regions. 
Cities within 60 miles of US-Canada border
Cities within 60 miles of US-Mexico border
Nationwide
Avg. violent crime rate3.99 3.424.43
Avg. property crime rate23.0915.3122.89

Average crime rates are lower in cities along the U.S.-Mexico border compared to cities along the U.S.-Canada border. Crime rates = incidents per 1,000 people. 


Crime in cities directly on the border vs. further out

Crime rates hold steady along the southern U.S. border regardless of a city's proximity to Mexico. Violent crime, for example, averages 3.27 in cities directly on the U.S.-Mexico border and 3.42 in cities within a 60-mile radius. 

Things look a little different along the northern border. Violent and property crime rates are highest in cities directly across from Canada, and they steadily decline in cities further away. The average crime rates in cities directly on the U.S.-Canada border are nearly twice that of cities directly on the U.S.-Mexico border. 

U.S.-Canada border
U.S.-Mexico border
Directly on border6.05 VC
30.82 PC
3.27 VC
17.05 PC
Within 10 miles5.04 VC
26.80 PC
3.31 VC
15.18 PC
Within 30 miles4.67 VC
23.72 PC
3.39 VC
14.77 PC
Within 60 miles3.99 VC
23.09 PC
3.39 VC
14.77 PC

Crime rates tend to increase closer to the U.S.-Canada border but hold steady at the U.S.-Mexico border. VC = violent crime rate; PC = property crime rate; Crime rates = incidents per 1,000 people. 


A closer look at border city safety

For the purposes of this report, the terms “dangerous” and “safest” refer explicitly to crime rates as calculated from FBI crime data—no other characterization of any community is implied or intended.

  • 115 border cities met our criteria for ranking and analysis — 60 along the U.S.-Mexico border and 55 along the U.S.-Canada border.
  • The 60 U.S.-Mexico border cities have a total population of nearly 6.1 million. Nearly 2.6 million people live in the 55 U.S.-Canada border cities. 
  • 3 border towns are the safest cities in their state: Anthony, NM; Sedro-Woolley, WA; and San Luis, AZ
  • San Diego, CA is the largest border town in the U.S. with a population of more than 1.3 million.
  • Havre, MT is the "most improved" city on our list thanks to a 9.8-point increase in its safety score.
  • Aggravated assault: Sedro-Woolley reported zero aggravated assaults in the 2026 reporting year. Highland Park, MI reported the highest aggravated assault rate (25.4 incidents per 1,000 people).
  • Murder: 88 of the 115 cities (77%) reported no murders in the 2026 reporting year. The top 4 cities with the highest murder rates are all located in Michigan: Highland Park (0.4 incidents per 1,000 people), Detroit (0.3), Flint (0.3), and Pontiac (0.2). 
  • Rape: 26 of the 115 cities (23%) reported zero rapes in the 2026 reporting year. Three cities reported a rape rate higher than 1 incident per 1,000 people: Havre (1.3), Inkster, MI (1.1), and Watertown, NY (1.1).
  • Robbery: Twelve of the 115 cities (10%) reported zero robberies in the 2026 reporting year. Highland Park reported the highest robbery rate (3.5 incidents per 1,000 people).
  • Burglary: Hamburg Village, NY was the only border city to report zero burglaries in the 2026 reporting year. Five cities reported a burglary rate higher than 5 incidents per 1,000 people: Highland Park (9.1), Las Cruces, NM (7.3), Detroit (7.3), Ogdensburg, NY (7.1), and Raymondville, TX (5.1). 
  • Larceny-Theft: Anthony was the only city with a larceny-theft rate lower than 1 incident per 1,000 people in the 2026 reporting year (0.7). Burlington, WA reported the highest larceny-theft rate (54.0).
  • Motor vehicle theft: Three cities tie for the lowest motor vehicle theft rate in the 2026 reporting year: Perrysburg, OH (0.1 incidents per 1,000 people), Perrysburg Township, OH (0.1), and Potsdam Village, NY (0.1). The top 3 motor vehicle theft rates were reported by cities in Michigan: Harper Woods (14.7), Detroit (12.6), and Highland Park (12.6).

The top 10 safest border cities

VC = Violent crime; PC = Property crime; Crime rates per 1,000 people

#1
Imperial, CA
(
+5
Up
)
  • Circle Population
    Population
    21,980
  • Circle Gun
    VC Rate 2026, 2025
    0.7, 1.5
  • Circle Property
    PC Rate 2026, 2025
    1.8, 2.7
#2
Perrysburg, OH
(
-0-
)
  • Circle Population
    Population
    25,302
  • Circle Gun
    VC Rate 2026, 2025
    0.3, 0.4
  • Circle Property
    PC Rate 2026, 2025
    4.5, 6.7
#3
Hamburg Village, NY
(
-2
Down
)
  • Circle Population
    Population
    9,742
  • Circle Gun
    VC Rate 2026, 2025
    0.4, 0.3
  • Circle Property
    PC Rate 2026, 2025
    4.3, 4.5
#4
Anthony, NM
(
+13
Up
)
  • Circle Population
    Population
    8,733
  • Circle Gun
    VC Rate 2026, 2025
    0.8, 2.1
  • Circle Property
    PC Rate 2026, 2025
    2.4, 4.6
  • Info
    #1 Safest City in New Mexico for 2026
#5
Sedro-Woolley, WA
(
-0-
)
  • Circle Population
    Population
    13,103
  • Circle Gun
    VC Rate 2026, 2025
    0.2, 0.3
  • Circle Property
    PC Rate 2026, 2025
    6.9, 10.6
  • Info
    #1 Safest City in Washington for 2026
#6
Lewiston Town and Village, NY
(
-2
Down
)
  • Circle Population
    Population
    15,616
  • Circle Gun
    VC Rate 2026, 2025
    0.4, 0.4
  • Circle Property
    PC Rate 2026, 2025
    7.6, 8.7
#7
San Luis, AZ
(
-4
Down
)
  • Circle Population
    Population
    38,809
  • Circle Gun
    VC Rate 2026, 2025
    0.9, 0.6
  • Circle Property
    PC Rate 2026, 2025
    5.6, 5.7
  • Info
    #1 Safest City in Arizona for 2026
#8
Horizon City, TX
(
+1
Up
)
  • Circle Population
    Population
    24,703
  • Circle Gun
    VC Rate 2026, 2025
    0.8, 0.6
  • Circle Property
    PC Rate 2026, 2025
    6.6, 9.0
#9
Potsdam Village, NY
(
+5
Up
)
  • Circle Population
    Population
    8,421
  • Circle Gun
    VC Rate 2026, 2025
    0.2, 0.6
  • Circle Property
    PC Rate 2026, 2025
    9.6, 12.0
#10
Sylvania, OH
(
-2
Down
)
  • Circle Population
    Population
    19,034
  • Circle Gun
    VC Rate 2026, 2025
    0.6, 0.8
  • Circle Property
    PC Rate 2026, 2025
    7.6, 7.5

The full list of border cities analyzed for this report

Rank
City
State
Population
Violent crime rate Icon Tooltip  Dark
Property crime rate Icon Tooltip  Dark
Approximate distance to border
1ImperialCalifornia21,9800.71.8Directly on border
2PerrysburgOhio25,3020.34.5Within 60 miles
3Hamburg VillageNew York9,7420.44.3Within 10 miles
4AnthonyNew Mexico8,7330.82.4Within 10 miles
5Sedro WoolleyWashington13,1030.26.9Within 60 miles
6Lewiston Town and VillageNew York15,6160.47.6Directly on border
7San LuisArizona38,8090.95.6Directly on border
8Horizon CityTexas24,7030.86.6Within 10 miles
9Potsdam VillageNew York8,4210.29.6Within 30 miles
10SylvaniaOhio19,0340.67.6Within 60 miles
11East Aurora-Aurora TownNew York13,8410.87.0Within 30 miles
12CalexicoCalifornia38,1061.45.4Directly on border
13PowayCalifornia47,8081.46.0Within 30 miles
14Perrysburg TownshipOhio13,7620.412.1Within 60 miles
15Oro ValleyArizona48,6800.511.5Within 60 miles
16SomertonArizona14,7171.85.3Within 10 miles
17SandpointIdaho10,4980.910.1Within 60 miles
18Oak HarborWashington23,8171.28.8Within 60 miles
19SahuaritaArizona37,0490.910.3Within 60 miles
20SocorroTexas39,5221.48.2Directly on border
21StanwoodWashington9,4661.011.3Within 60 miles
22MiltonVermont10,7331.96.7Within 30 miles
23Solana BeachCalifornia12,5921.011.8Within 30 miles
24WhitefishMontana9,6481.211.2Within 60 miles
25San MarcosCalifornia93,9742.26.7Within 60 miles
26MurrietaCalifornia112,1251.89.5Within 60 miles
27SanteeCalifornia59,3512.55.7Within 30 miles
28Hamburg TownNew York47,6870.516.3Within 30 miles
29Sylvania TownshipOhio31,7260.715.4Within 60 miles
30North TonawandaNew York29,8981.412.2Within 10 miles
31DouglasArizona15,3590.815.8Directly on border
32AnacortesWashington18,1230.915.6Within 60 miles
33RomaTexas11,5522.67.0Directly on border
34MissionTexas87,7771.811.5Directly on border
35EncinitasCalifornia60,4612.29.6Within 60 miles
36TonawandaNew York14,8251.712.7Within 10 miles
37HidalgoTexas14,9101.314.5Directly on border
38LyndenWashington16,8051.812.1Directly on border
39Del RioTexas34,5321.713.1Directly on border
40San ClementeCalifornia61,6921.812.8Within 60 miles
41FerndaleWashington16,2931.116.8Within 30 miles
42PharrTexas80,6042.111.6Directly on border
43San JuanTexas36,8191.614.3Directly on border
44BrawleyCalifornia28,3113.07.7Within 30 miles
45Sunland ParkNew Mexico17,9963.36.1Directly on border
46Depew VillageNew York14,8051.416.8Within 30 miles
47Tonawanda TownNew York56,1100.820.0Within 10 miles
48Kenmore VillageNew York14,8301.417.5Within 10 miles
49West Seneca TownNew York44,9821.218.4Within 10 miles
50VistaCalifornia98,2903.28.8Within 60 miles
51CarlsbadCalifornia113,0232.015.6Within 60 miles
52McAllenTexas148,0171.518.4Directly on border
53Eagle PassTexas28,3231.419.1Directly on border
54El CentroCalifornia43,5503.210.1Within 10 miles
55Rio Grande CityTexas15,3201.817.4Directly on border
56Mount VernonWashington35,2441.918.0Within 60 miles
57Sierra VistaArizona44,1192.216.7Within 30 miles
58ColchesterVermont17,6172.217.9Within 60 miles
59El PasoTexas678,8602.815.1Directly on border
60Massena VillageNew York10,0281.423.2Within 10 miles
61MinotNorth Dakota47,0413.114.4Within 60 miles
62Chula VistaCalifornia273,8433.711.5Within 10 miles
63EdinburgTexas107,5522.617.6Within 10 miles
64MaumeeOhio13,5581.624.2Within 60 miles
65Presque IsleMaine8,6422.122.1Within 30 miles
66CoronadoCalifornia18,5453.316.3Within 30 miles
67LaredoTexas258,3113.615.0Directly on border
68Imperial BeachCalifornia25,2475.46.4Directly on border
69YumaArizona101,9894.213.0Within 10 miles
70Lemon GroveCalifornia27,5594.711.1Within 10 miles
71La MesaCalifornia60,3524.214.2Within 10 miles
72El CajonCalifornia101,9834.315.3Within 30 miles
73EscondidoCalifornia147,1704.415.0Within 60 miles
74San DiegoCalifornia1,389,0244.116.8Within 30 miles
75UvaldeTexas15,5093.918.9Within 60 miles
76PalmviewTexas15,8874.715.2Directly on border
77HarlingenTexas71,3882.527.3Directly on border
78OceansideCalifornia168,7254.517.0Within 60 miles
79ArlingtonWashington21,6103.524.4Within 60 miles
80BrownsvilleTexas191,2214.519.6Directly on border
81San BenitoTexas24,3822.629.2Directly on border
82Cheektowaga TownNew York78,8642.034.7Within 10 miles
83WillistonNorth Dakota27,2114.323.3Within 60 miles
84Niagara TownNew York7,6711.640.3Within 10 miles
85MercedesTexas16,8933.832.1Directly on border
86OregonOhio19,6391.942.3Within 60 miles
87AltonTexas22,1408.311.2Within 10 miles
88National CityCalifornia54,9157.119.7Within 30 miles
89South BurlingtonVermont21,3002.444.1Within 60 miles
90WeslacoTexas43,8984.434.6Directly on border
91Los FresnosTexas8,4397.916.8Within 30 miles
92Niagara FallsNew York47,2965.032.1Directly on border
93BellinghamWashington95,7173.540.8Within 30 miles
94BurtonMichigan29,2807.423.4Within 60 miles
95TaylorMichigan60,6028.320.8Within 30 miles
96RaymondvilleTexas10,1008.420.4Within 60 miles
97TucsonArizona548,7895.933.7Within 60 miles
98HavreMontana9,3285.735.1Within 60 miles
99BurlingtonWashington10,7620.760.8Within 60 miles
100RomulusMichigan24,5678.821.3Within 30 miles
101PontiacMichigan61,6449.816.8Within 30 miles
102BurlingtonVermont44,4564.843.2Within 60 miles
103OgdensburgNew York9,1254.446.2Directly on border
104WatertownNew York24,0295.442.9Within 30 miles
105InksterMichigan24,75110.718.2Within 30 miles
106FlintMichigan79,18312.513.3Within 60 miles
107BuffaloNew York273,7287.043.2Directly on border
108AlamoTexas20,7348.835.5Directly on border
109ToledoOhio263,66810.427.8Within 60 miles
110Harper WoodsMichigan14,7177.743.4Within 10 miles
111Las CrucesNew Mexico115,9777.249.5Within 60 miles
112Flint TownshipMichigan30,7519.142.6Within 60 miles
113DonnaTexas16,78117.543.6Directly on border
114DetroitMichigan651,17117.743.7Directly on border
115Highland ParkMichigan8,28029.844.0Within 10 miles
con
Why isn't my city on this list?
  1. It didn't meet our minimum population requirement: We only looked at cities with a population greater than the median population of all U.S. cities that submitted a complete report to the FBI's National Incident-Based Reporting System (NIBRS) for the most recent completed reporting year, which is about 6,800. This helps us avoid outliers that skew the data.
  2. It didn't report recent data to the FBI: We use data that's been reported to the FBI/NIBRS. Cities aren't required to share their data with the FBI, but nearly 80% do.
  3. It didn't meet our location requirements: We decided to define a border city as one with a straight-line distance of 60 miles or less to a land crossing into Canada or Mexico. We didn't count cities where you would have to get in a boat or climb a mountain to meet the 60-mile limit.

From rankings to real-world safety

Our Safest Cities rankings help highlight crime incidence patterns and relative risk — but they don’t determine what happens in a community or a home. How safe a community is (or isn't) is the result of a mix of individual choices, community conditions, and external factors like the economy, job market, housing availability, and local priorities.

Expand the sections below for a closer look at what you can do to help improve the safety of your community.

It's not possible to eliminate risk entirely, but you can reduce your potential risk by staying informed about local crime trends, practicing situational awareness (know who belongs in your neighborhood, work parking lot, etc.), and taking practical steps to protect yourself and your property.

Getting involved in your community can make a big difference — but you should expect certain baseline crime prevention measures from your neighborhood and city.

  • Good lighting in public spaces
  • Visible community law enforcement presence
  • Neighborhood watch-type groups/support
  • Access to a community liasion officer or department
  • Budget to support community safety programs (beyond law enforcement)

Strong local networks — whether formal or informal (or in-person or virtual) — can play an essential role in improving safety beyond what statistics alone can capture.

Our research and national crime data consistently point to the value of layered prevention. This means that the more layers you put between your home and loved ones and criminals, the better chance you have of actually deterring a criminal act.

Multiple security layers can look like a neighborhood watch plan combined with locking your doors when you leave the house, and a security camera with a siren that can scare an intruder away. A monitored security system that connects you to faster help if something happens adds an extra proactive layer.

Research-backed practices that help reduce exposure include:

  • Community prevention: Improved lighting, clear sightlines (trim hedges and bushes near doors/windows), and coordinated neighborhood efforts
  • Awareness and reporting: Stay alert, trust your instincts, know who and what belongs in your neighborhood, and report suspicious behavior
  • Home safety fundamentals: Secure all entry points (don't forget the deck or the sliding glass door), eliminate hiding spots around your home, and get into consistent security routines (locking the door, arming the security system)
  • Targeted technology use: Pair common-sense safety habits with tools that support awareness or response, like monitored security systems or cameras

Find the safest cities in each state

Click on the state below to check out the safest cities for each state.

How we determine and interpret these rankings

Our Safest Cities rankings offer a data-informed look at crime trends across cities. They’re designed to highlight relative risk — not to define overall quality of life or what it’s like to live in a community.

We use the most recent FBI-reported violent and property crime data, and adjust for population so we can compare cities of different sizes fairly. This approach helps us identify patterns and differences in reported crime rates.

Our analysis includes only crime data from agencies that submitted complete reports to the FBI through the National Incident-Based Reporting System (NIBRS). We do not estimate crime totals for agencies with incomplete reporting, so our findings and crime rate trends may differ from reports that include estimated national crime data.

We understand that crime statistics reported to one source don’t tell the whole story. A number of factors, including local agency reporting practices, community resources, prevention efforts, and lived experience all influence how safe a place is (or is perceived to be) — and not all of that shows up in the numbers.

Think of these rankings as a starting point. Our goal is to help readers understand crime trends and ask informed questions, not to judge communities or the people who call them home.

Learn how we identified the safest cities on our methodology page.

Get a deeper understanding of our independent research, data sources, calculations, and how we refine our reports each year.

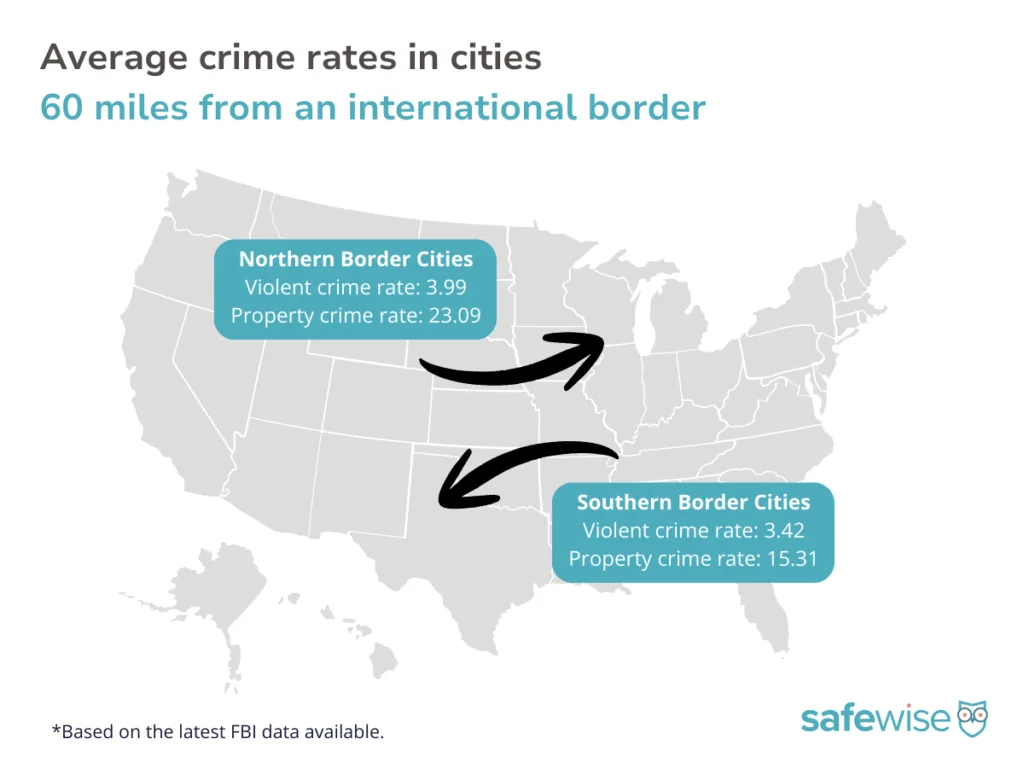
Find all endnotes and sources in our full methodology.

FBI Crime Data Explorer, "Documents & Downloads." 

  • 2024 Crime in the United States Annual Reports
    • Offenses Known to Law Enforcement
  • 2024 NIBRS Estimation Tables

Bureau of Justice Statistics, "National Incident-Based Reporting System (NIBRS)." 

Gun Violence Archive, "Mass Shootings." 

Safest Cities Badges:
Safest Cities badges are available at no charge for use by law enforcement agencies and city government. City government and law enforcement representatives should contact [email protected]
to inquire about badge usage.

To request a badge:

  • Please put "Safest Cities badge request" in your subject line
  • Include the name of your city and state
  • Share the city government or law enforcement agency you represent

Badges are also available for licensing by other entities, including tourism boards, local businesses, and similar organizations. All other interested parties should contact our official partner, Wright’s Media, for information on available usages, license fees, and award seal artwork at [email protected].

Cathy Habas
Written by
With over 12 years of experience as a content writer, Cathy has a knack for untangling complex information. Her natural curiosity and ability to empathize help Cathy offer insightful, friendly advice. She believes in empowering readers who may not feel confident about a purchase, project, or topic. Cathy earned her Bachelor of Arts degree in English from Indiana University Southeast and began her professional writing career immediately after graduation. She is a certified Safe Sleep Ambassador and has contributed to sites like Safety.com, Reviews.com, Hunker, and Thumbtack. Cathy’s pride and joy is her Appaloosa “Chacos.” She also likes to crochet while watching stand-up comedy specials on Netflix.

Recent Articles

nanny playing with baby
Best Nanny Cams of 2026
Nanny cams let you keep a close eye on your kids and their caretakers. Read...
Vivint installer adding the Spotlight Pro to my Vivint Outdoor Camera Pro.
I Had the Vivint Spotlight Pro Installed, Here’s What I Found Out
I got the Vivint Spotlight Pro installed at my home. Here's how everything went and...
Vivint sign and Vivint installer adding equipment to home.
Vivint Installation
Vivint is installed by a professional. We tried out the installation process and chatted with...
simplisafe camera mounted on outside of house
Best No Subscription Home Security Systems in 2026
After research and testing, we picked Eufy as the best home security system without a...