The State of Safety in America is SafeWise’s annual, nationally representative study tracking how Americans perceive, experience, and respond to safety risks over time. The findings in this report serve as the foundation for SafeWise’s rankings, special reports, and ongoing safety analyses throughout the year.
The State of Safety in America 2026
A comprehensive look at how Americans experience safety, beyond official crime statistics.
years of comparative data
7
Americans surveyed per state
100
total responses per year
5,000
questions fielded in 2025
34
For over 13 years, SafeWise experts have conducted independent research and testing to write unbiased, human reviews (not robots). Learn more.
Editor's note
I want to acknowledge that some of our readers may be feeling unsafe in their homes and on the streets given the concerning events that have happened so far in 2026. The report you're about to read captures how Americans felt in 2025. Our survey revealed some hopeful trends regarding crime and security across the nation, and these data may feel disconnected from current affairs. As we untangle what it means to be and feel safe in 2026, we will continue to update our data reports and guides.

— Rebecca Edwards, Managing Editor, SafeWise.com
Executive summary:
Crime fears are easing — but safety still isn’t a given
Americans' perceptions of crime and personal safety have become more optimistic over the past year, but what we're worried about remains relatively unchanged.
While 54% say crime has increased compared to last year, that percentage is actually at its lowest point in years. More stats than ever are saying crime may actually be going down, and Americans are taking notice. Fewer people say they worried about crime in 2025 compared to 2024.
Still, safety is far from a non-issue. Only about half of Americans say they feel safe in their state, and they're gearing up to protect their homes. Nearly 50% of American households now use security cameras, and one in three rely on a full-blown security system.
For the first time since we began tracking protection behaviors, firearms are no longer among the top three methods Americans use to protect their property — but their use increased as a personal protection method.
All of this adds up to an increasingly proactive and confident mindset toward safety, but Americans remain wary of new threats like artificial intelligence.
Get the details
Which states are the most worried about crime and safety?
Every year, we ask Americans how much they worry about crime and safety, in general. The country has hovered around the 50% mark for years, with nearly half of Americans regularly worrying about safety. This year, 46% of survey respondents expressed a high level of concern about their safety. The most concerned state, Pennsylvania, saw 66% expressing concern, while the least concerned state, South Dakota, saw 30% expressing concern.
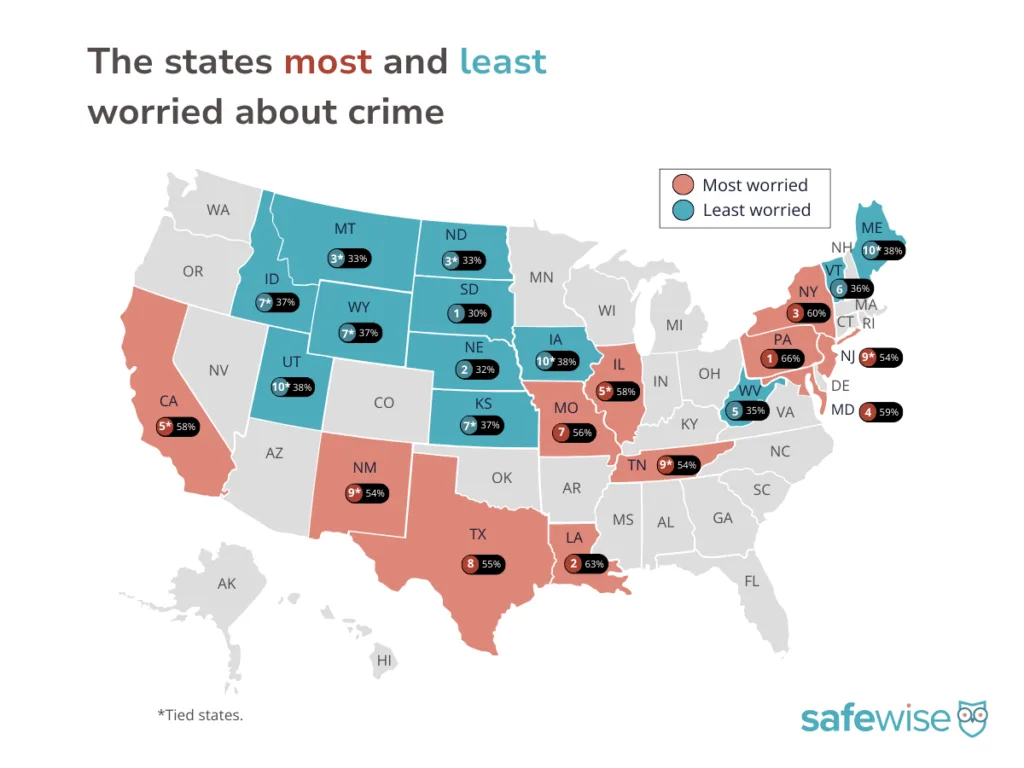
The states that reported the most and least concern about crime and safety. Image: SafeWise, State of Safety report, B1. Using a scale from 1 to 7, where ‘1’ is not at all concerned and ‘7’ is very concerned, overall, how concerned were you about your safety and/or security in 2025? Among each state, 100n.
The most worried states:
1. Pennsylvania, 66%
2. Louisiana, 63%
3. New York, 60%
4. Maryland, 59%
5. (tie) Illinois, 58%
5. (tie) California, 58%
7. Missouri, 56%
8. Texas, 55%
9. (tie) Tennessee, 54%
9. (tie) New Mexico, 54%
9. (tie) New Jersey, 54%
The least worried states:
1. South Dakota, 30%
2. Nebraska, 32%
3. (tie) Montana, 33%
3. (tie) North Dakota, 33%
5. West Virginia, 35%
6. Vermont, 36%
7. (tie) Idaho, 37%
7. (tie) Kansas, 37%
7. (tie) Wyoming, 37%
10. (tie) Iowa, 38%
10. (tie) Maine, 38%
10. (tie) Utah, 38%
U.S. average
46% of respondents are concerned about crime and safety.
Where Americans feel safe — and where they don’t
On top of asking people how much they worry about safety every day, we wanted to find out if people feel safe in their state. Nationwide, 52% of Americans feel safe in the state they call home, six percentage points higher than those who regularly worry about crime and safety.
New Hampshire is the state where the highest number of residents (71%) report feeling safe. Unsurprisingly, New Hampshirites ranked toward the bottom (32th place) for the percentage of people who increased their safety and security measures in 2025.
For the second year in a row, New Mexico has the lowest percentage of residents (28%) who report feeling safe. The state ranked 20th for the percentage of people who have increased their safety and security measures.
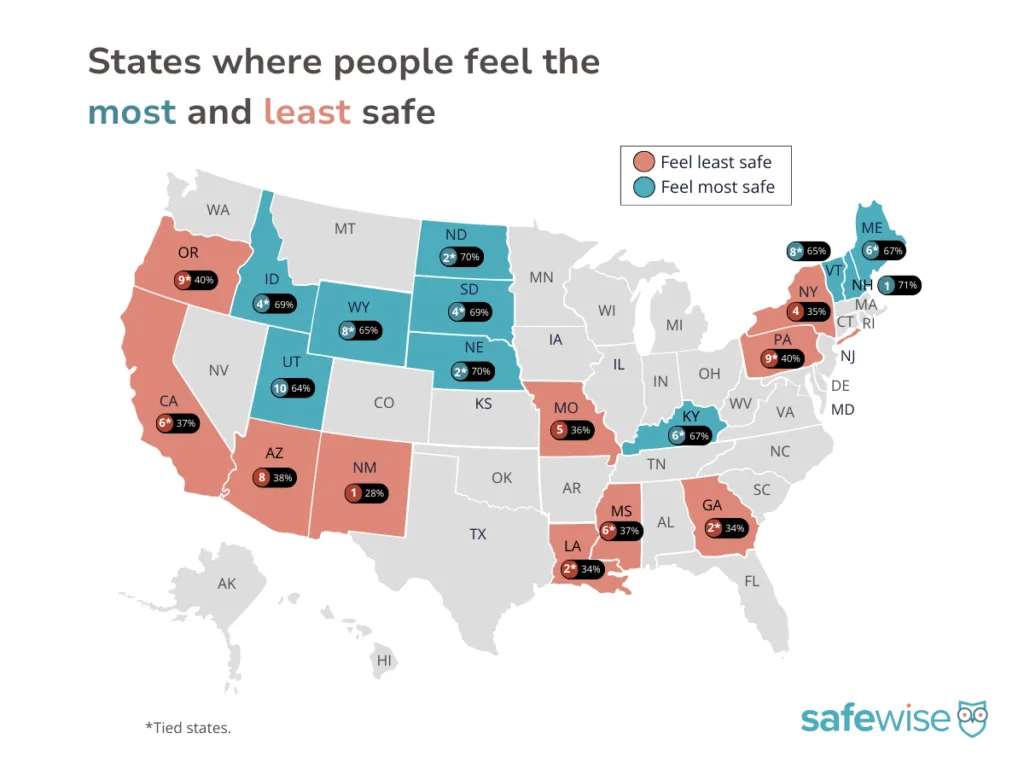
The states that reported feeling the most and least safe in their state. Image: SafeWise, State of Safety report, B4. Using a scale from 1 to 7, where ‘1’ is not at all safe and ‘7’ is very safe, overall, how safe do you think your state is so far in 2025? among all.
The states that feel the most safe:
1. New Hampshire, 71%
2. (tie) Nebraska, 70%
2. (tie) North Dakota, 70%
4. (tie) Idaho, 69%
4. (tie) South Dakota, 69%
6. (tie) Kentucky, 67%
6. (tie) Maine, 67%
8. (tie) Wyoming, 65%
8. (tie) Vermont, 65%
10. Utah, 64%
The states that feel the least safe:
1. New Mexico, 28%
2. (tie) Georgia, 34%
2. (tie) Louisiana, 34%
4. New York, 35%
5. Missouri, 36%
6. (tie) California, 37%
6. (tie) Mississippi, 37%
8. Arizona, 38%
9. (tie) Pennsylvania, 40%
9. (tie) Oregon, 40%
U.S. average
52% of people feel safe in their state.
Crime trends vs. lived experience: What the data shows in 2025
Roughly half of Americans report being concerned about safety, consistent with the findings from our 2024 survey. The threat of violence continues to be more concerning than burglary and theft.
One of the most surprising findings is that more Americans believe crime has decreased in the past year compared to 2024. However, the overwhelming majority still believe that crime overall increased in 2025.
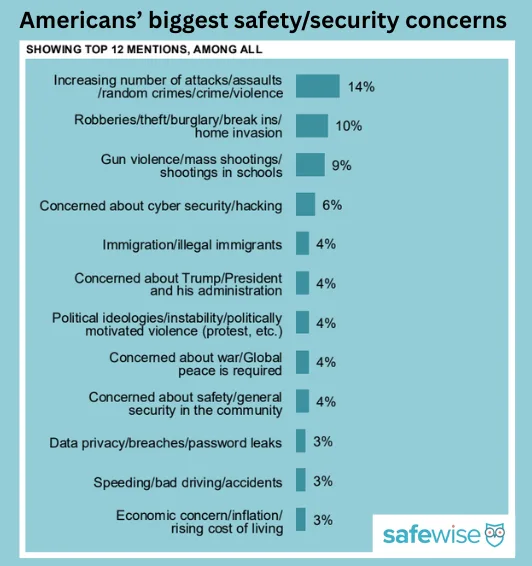
A bar graph showing which safety and security concerns Americans told us they worry about the most, in their own words. Image: SafeWise State of Safety report, B2. What was your biggest safety or security concern in the past year? Among all, 5000n.
In open-ended questions, people mentioned concerns about safety at home, walking/running in their neighborhoods, and on the roads (road rage). We also saw mentions of social issues like political unrest/instability, immigration, and war.
Note: SafeWise is currently conducting a follow-up “pulse” survey examining how recent immigration enforcement activity is affecting perceptions of safety. Findings will be published separately in the coming weeks.
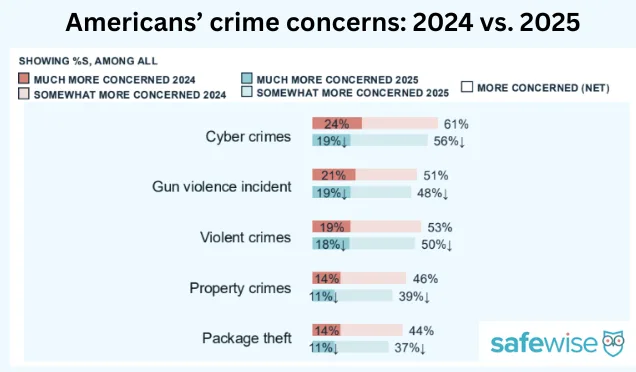
This graph shows how concerned Americans have been about different crimes over time, from 2020 to 2025. Image: SafeWise State of Safety report, C1. Using a scale from 1 to 7, where ‘1’ is not at all concerned and ‘7’ is very concerned, how concerned are you about the following happening to you in 2025? Among all in 2025, 5000n; 2024, 5000n; 2022, 5000n; 2021, 5000n; 2020, 5026n.
Top concerns
For the second year in a row, cybercrimes topped the list of crime concerns, especially for older adults, who reported increased concern and increased experiences with cybercrime last year. Violent crimes and gun violence are the second-highest concerns, with younger adults (below 55) and women reporting the most concern.
Interestingly, the percentage of Americans who worry about these crimes dropped in 2025 compared to 2024. Property crime and package theft concerns also declined year over year.
“I was worried most about my
car being broken into or items
such as packages being
stolen.”
—18-24, Male, Northeast
—18-24, Male, Northeast
“I am concerned about being
safe at night in my own
house.”
—25-34, Female, Midwest
—25-34, Female, Midwest
“Gun violence. With school
shootings to gang violence,
you can’t escape it.”
—18-24, Female, Midwest
—18-24, Female, Midwest
Top issues
When it comes to social and political issues, the economy remains the biggest concern, with four in five Americans worrying about it. Political unrest/instability and gun control are the next most-concerning issues, with well over half of all respondents expressing concern.
Those who cited political unrest/instability as a top concern were asked follow-up questions to clarify their worries. The top three answers were "misinformation or disinformation influencing public behavior," "threats to democratic processes," and "political polarization."
Concerns about immigration have decreased since 2024. Now, more people worry about artificial intelligence (54%) than immigration (52%). Religion and gender remain the least worrisome issues for Americans, with fewer than 3 in 10 people expressing concern about either topic.
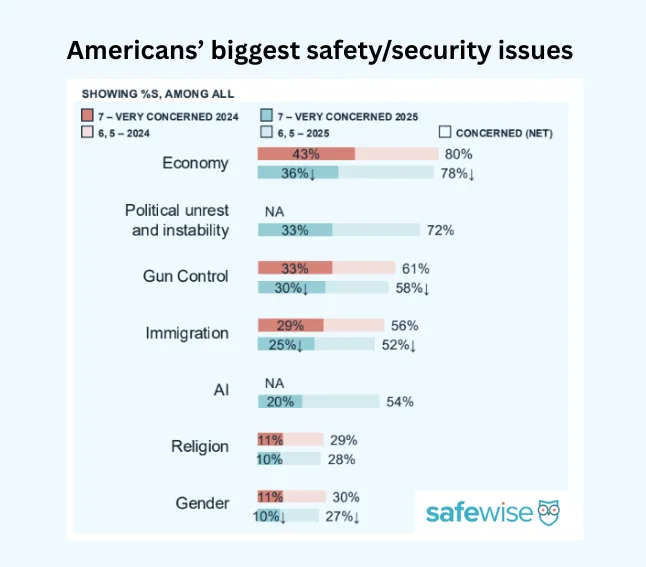
The social and political issues that Americans are most concerned about. Image: SafeWise State of Safety report, B10. Using a scale from 1 to 7, where ‘1’ is not at all concerned and ‘7’ is very concerned, how concerned are you about the following issues? Among all, 5000n.
Cybersecurity and tech
More than half of Americans reported being more concerned about cybercrime in 2025 than they had been the previous year. Older adults express the highest levels of concern, which makes sense considering they also reported the highest levels of personal experience with cybercrime.
Among all respondents, 27% reported experiencing some form of cybercrime in 2025. That's down from 33% in 2024. Online scams/phishing attacks were most common, but people tend not to worry about these cybercrimes as much as they worry about personal account hacking, identity theft, data breaches, and financial fraud.
Cyber protection is now mainstream, with nearly three-quarters of respondents relying on at least one method of protection. Two-factor authentication and antivirus software are the most widely used.
For more information on cybercrime affecting children, check out our Kids Internet Safety Guide.
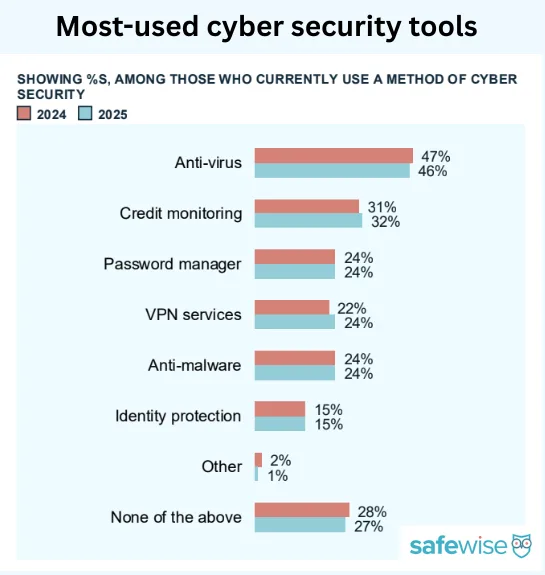
Anti-virus software is the most widely used cybersecurity tool. Image: SafeWise State of Safety report, D10. Do you currently use any of the following to provide cybersecurity? Among those who currently use a method of cybersecurity: 2025, 3589n; 2024, 3669n.
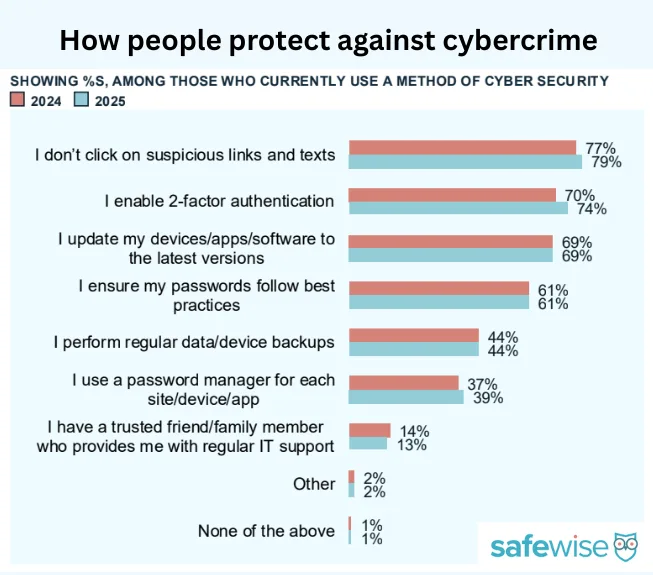
Most people avoid clicking on suspicious texts and links to protect against cybercrime. Image: SafeWise State of Safety report, D9. Which of the following best describes how you use cybersecurity measures? Among those who currently use a method of cybersecurity: 2025, 3589m; 2024, 3669n.
Extreme weather and natural disasters
With recent events like the Los Angeles area fires, Texas floods, and ongoing extreme weather alerts across the country, it's no surprise that Americans are more worried about natural disasters than ever before. More than half of all survey respondents told us they're concerned about extreme weather and natural disasters, which is the highest level of concern we've seen.
Fortunately, higher levels of concern don't correlate to higher evacuation rates. In 2025, only 9% told us they'd been under an evacuation order, which is in line with the findings from our 2024 survey.
This disconnect between rising concern and steady evacuation rates may reflect heightened awareness, more frequent weather warnings, or increased media attention. Whatever the reason, Americans are paying closer attention to the weather — and many are feeling less safe because of it.
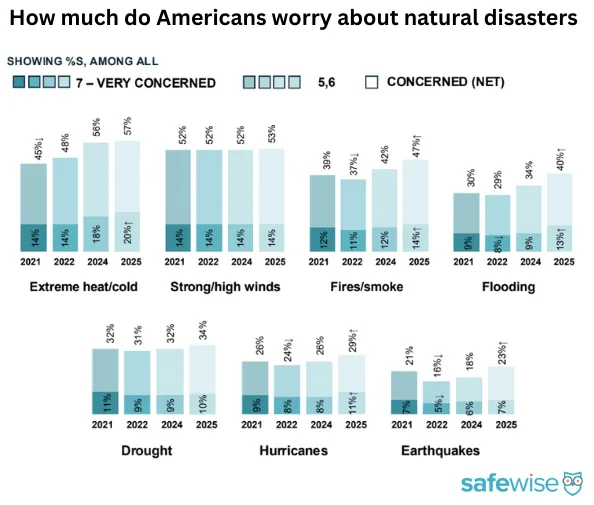
Extreme heat and cold are the most worrisome natural disasters for Americans. Image: SafeWise State of Safety report, F1. Using a scale from 1 to 7, where ‘1’ is not at all concerned and ‘7’ is very concerned, overall, how concerned were you about the following natural disasters this year?
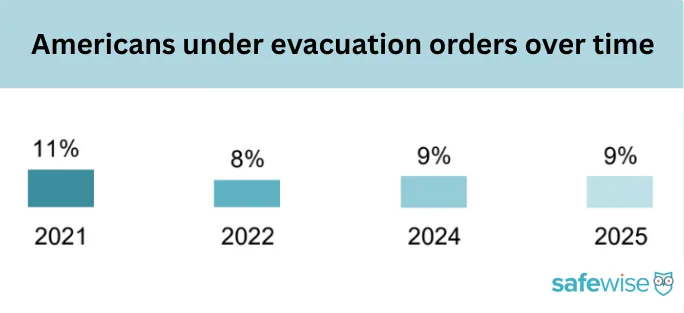
2021 saw more Americans under evacuation orders than 2022, 2024, or 2025. Image: SafeWise State of Safety report, F2. Did you (or the area where you live) experience evacuation due to natural disasters (e.g., hurricane, fires/smoke, flooding, etc.) this year? Among all in 2024, 5000n. 2022, 5000n. 2021, 5000n.
How Americans are changing the way they protect their homes and families
Notable shift in 2025:
For the first time in State of Safety history, firearms are no longer among the top three forms of property protection Americans report using — reflecting growing reliance on cameras, security systems, and non-lethal measures. However, firearms rank first among personal protection measures for the first time, displacing knives.
As concerns around violence, theft, and cybercrime grow, more Americans are taking action to protect themselves — both at home and on the go. A desire to prevent future incidents is the driving force behind this shift. In fact, preventing a security or safety breach is now the number one reason people are investing in protection, and mentions of that motivation have grown significantly since 2022.
This shift isn’t just about fear — it’s about lived experience. People who’ve already encountered crime, or who feel generally unsafe, were much more likely to have added new protection methods in 2025. That includes everything from upgrading home security systems to carrying personal protection tools.
On the property side, the use of security cameras has jumped meaningfully compared to previous years, and more people are turning to insurance, alarm systems, and other home safety tools to feel more secure. Auto and homeowner’s insurance, along with fire alarms and monitored systems, remain go-to choices for many.
When it comes to personal safety, firearms top the list for the first time in years. Americans also tend to reach for pocket knives and pepper spray, though preferences vary by gender and household. Men lean more heavily toward firearms and knives, while women are more than two times more likely to carry pepper spray than men. Households with children turn to a wider range of options, from stun guns to safety apps to protective keychains.
All of these points indicate a clear trend: Americans aren’t just more aware of safety issues — they’re increasingly willing to take matters into their own hands to protect themselves.
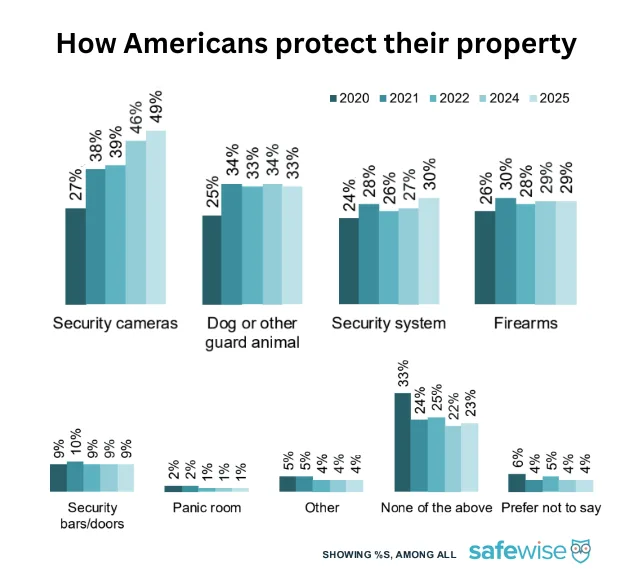
Comparison of the methods Americans use to protect their property over time, from 2020 to 2025. Image: SafeWise State of Safety report, D2. Do you currently use any of the following to protect your property? Among all in 2025, 5000n. 2024, 5000n. 2022, 5000n. 2021, 5000n. 2020, 5026n.
Property protection trends
More Americans are investing in home and personal security, with one in three increasing their security or safety measures in 2025. Still, many Americans (23%) don't have formal protection in place. Security cameras, life insurance, and homeowners' insurance remain top go-to methods.
Security camera use continues to rise, and now nearly half of all Americans rely on security cameras to protect their property. Security system use is also on the rise. Other property protection methods, like guard animals, firearms, and security bars, have held stable in use over the last few years.
Men are more likely than women to protect their property with firearms and security systems, while women are more likely to rely on guard animals. Security cameras are more common in households with children, and people in the South tend to report the highest levels of security camera, guard animal, security system, and firearm use.
Preventing a future security or safety breach is the number one reason people increased their security methods. Neighborhood crime, family and friend recommendations, and experiencing a safety or security breach are the next most common reasons for adding extra security.
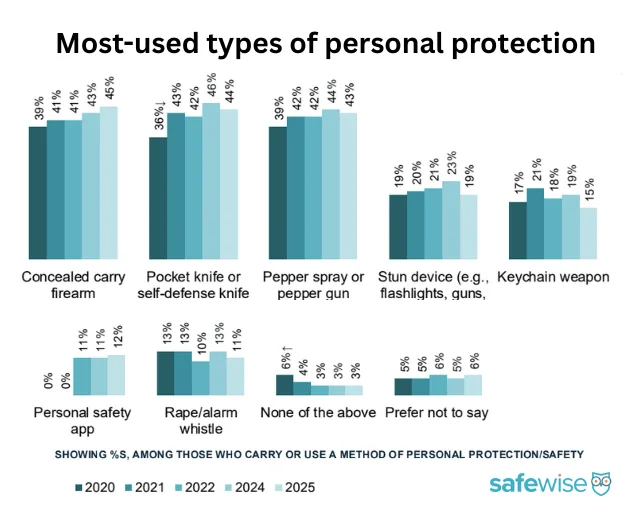
Comparison of the methods Americans use to protect their property over time, from 2020 to 2025. Image: SafeWise, 2026 State of Safety report, D5. Do you use any of the following for personal protection? Among those who carry or use a method of personal protection/safety in 2025, 1621n; 2024, 1758n; 2022, 1817n; 2021, 1974n; 2020, 1604n.
Why people increased security and safety measures
“To protect my family in case of
a break-in as well as protection
from wild animals. We got the
security system to prevent break-ins and thefts of packages,
tools, or other outdoor items.”
—18-24, Female, Northeast
—18-24, Female, Northeast
“The increasing crime in the
urban area has concern. I need
to protect family makes me
cautious about all that is going
on around the city and the
neighborhood.”
—65+, Male, Midwest
—65+, Male, Midwest
What Americans actually experience vs. what crime statistics capture
While public concern around safety remains high, the types of crime Americans are actually experiencing paint a more focused picture. Overall, self-reported crime rates were lower in 2025 than in 2024, but some key trends stand out — especially when it comes to theft and digital threats.
Package theft continues to be the most commonly reported crime. After hitting an all-time high in 2024, package theft incidents dropped to the lowest number seen since 2020 — reflecting the findings of our 2025 Package Theft report, where the estimated number of packages stolen decreased for the first time ever. Cybercrime is the second most common type of crime, reported by roughly one in three Americans. Property crime rounds out the top three with an incidence rate of 21%.
In contrast, violent crimes and gun violence are far less frequently experienced but remain some of the most feared. That gap between concern and actual experience likely reflects the severity and unpredictability of those incidents, even if they're statistically less common.
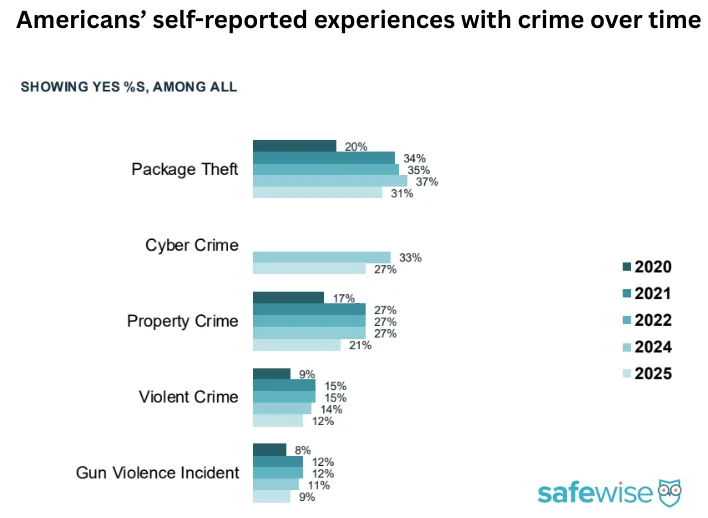
The percentage of survey respondents who reported a personal experience with crime. Image: SafeWise, 2026 State of Safety report, C2. Have you, or anyone you know, experienced the following in 2024 so far? Among all in 2025, 5000n. 2024, 5000n. 2022, 5000n. 2021, 5000n. 2020, 5026n.
Certain groups are consistently less likely to report experiencing crime. Adults 55 and older — who also tend to feel safer overall — are the least likely to say they've encountered any kind of crime. Households without children also report lower personal experiences with crime across the board.
Interestingly, women were as likely to have experienced violent crime and gun violence as men. The risk of experiencing violence decreased with age, but package theft, cybercrime, and property crime become more common in middle age. Property crime is less common in the Northeast, but there are no meaningful regional differences in other types of crime.
Why crime data can tell different stories
National crime statistics show overall declines in certain crime categories. However, SafeWise’s analysis of Safest Cities data — based only on agencies reporting complete data to NIBRS and without estimating missing jurisdictions — shows year-over-year increases in some crime types from 2023 to 2024.
These differences reflect methodology, reporting completeness, and what is being measured — not necessarily disagreement about lived experience.
States with the highest self-reported crime
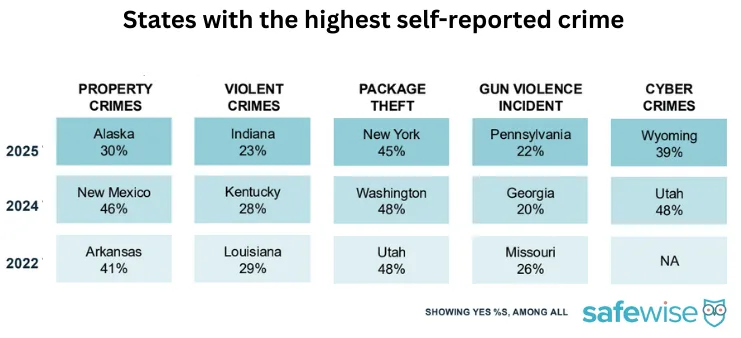
The states with the highest number of people reporting personal experiences with different types of crime in 2022 and 2024. Utah is the only state that appears in both years: it reported the highest package theft in 2022 and the highest cybercrimes in 2024. Image: SafeWise, 2022 State of Safety report, C2. Have you, or anyone you know, experienced the following in 2025 so far? Among all in 2025, 5000n. 2024, 5000n. 2022, 5000n.
These are the states with the highest and lowest reported experiences with crime:
Property crimes:
- Alaska, 30%
- Massachusetts, 6%
- U.S. average, 21%
Violent crimes:
- Indiana, 23%
- Kansas, 4%
- U.S. average, 12%
Package theft:
- New York, 45%
- Maine, 16%
- U.S. average, 31%
Gun violence incident:
- Pennsylvania, 22%
- (tie) South Dakota, New Hampshire, Arizona, 3%
- U.S. average, 9%
Cybercrimes:
- Wyoming, 39%
- New Mexico, 18%
- U.S. average, 27%
Trends in self-reported crime experiences
Nationally, our survey respondents were less likely to have experienced any type of crime in 2025 compared to 2024. Property crime, package theft, and cyber crime saw the most meaningful drops (6 percentage points each).
Sixteen states matched national trends by reporting year-over-year declines in all types of crime:
- Alabama
- Arizona
- Connecticut
- Georgia
- Hawaii
- Idaho
- Illinois
- Iowa
- Minnesota
- Nevada
- New Hampshire
- New Jersey
- Oklahoma
- Oregon
- South Carolina
- West Virginia
No state saw increases across the board, but several came close. Maryland residents, for example, reported increased or stable crime in all categories except package theft, while New Yorkers, North Dakotans, and Pennsylvanians reported increased or stable crime in all categories except property crime.
Here's a quick look at how last year's self-reported crime trends shake out across the country:
- Violent crime: Down in 32 states, up in 14 states, no change in 4 states.
- Gun violence: Down in 36 states, up in 13 states, no change in 1 state.
- Property crime: Down in 42 states, up in 5 states, no change in 3 states.
- Package theft: Down in 42 states, up in 6 states, no change in 2 states.
- Cybercrime: Down in 37 states, up in 11 states, no change in 2 states.
What differs by demographic
Safety concerns vary significantly by age, gender, income, household composition, and region:
- Households with children and individuals under 55 are most concerned about safety, followed by women.
- Individuals with household incomes under $50K are more likely to report concern about their safety.
- Individuals living in urban areas or with household incomes below $50K are more likely to believe that crime has increased.
- Those with household incomes of $150K or more tend to think that crime has decreased.
- Men and individuals aged 55+ are more likely to believe that their state is safe.
- Those under 55 years old are especially likely to name war and the economy as key concerns.
- Northeasterners are significantly more likely to be concerned about gun control.
- Women are more likely than men to cite the economy, gender, gun control, and AI as concerns.
- Those living in urban areas are more likely to be concerned about all types of crime (except for cybercrime).
About the State of Safety Survey: How this data is collected and used
The State of Safety in America is SafeWise’s annual, nationally representative survey tracking how people in the U.S. perceive, experience, and respond to safety risks.
Each year, we survey at least 5,000 U.S. adults across all 50 states to understand:
- How safe people feel where they live
- What types of crime and safety threats concern them most
- What safety incidents they personally experience
- How they protect themselves, their homes, and their families
The survey has been conducted annually for seven years, allowing SafeWise to analyze long-term trends, year-over-year shifts, and emerging safety concerns.*
Learn more about the data and how we use it below.
The State of Safety survey focuses on lived experience and perception, which are often missing from official crime statistics.
Specifically, this data:
- Captures how safe people feel, not just what is reported
- Reflects self-reported experiences with crime and safety incidents
- Shows behavioral responses to fear and risk (e.g., security adoption, avoidance, relocation)
- Identifies gaps between official statistics and public sentiment
This approach helps explain why crime data can sometimes appear to tell conflicting stories — and why public concern may rise even when certain crime categories decline nationally.
Official crime statistics (including FBI data) capture reported incidents from law enforcement agencies. That’s essential context — but it’s incomplete. The State of Safety survey captures attitudes, perceptions, and behavior related to crime and safety. This research approach complements those datasets by measuring human impact, including:
- Fear and anxiety
- Perceived neighborhood safety
- Self-reported crime and safety experiences
- Behavior changes driven by safety concerns
Taken together, crime statistics and State of Safety data provide a more holistic view of safety in the U.S. We analyze safety concerns, experienced safety incidents, protection behaviors, and demographic differences to track trends over time, identify emerging risks, and compare attitudes across regions — revealing how safety is experienced, not just how it’s recorded.
Findings from the State of Safety survey serve as the foundation for:
- The annual State of Safety report
- Safest Cities rankings and analysis
- Special topic reports (e.g., package theft, cybercrime, immigration)
- Ongoing safety coverage throughout the year
Survey questions are reviewed and updated annually to reflect current events, emerging risks, and evolving public concerns, while maintaining continuity to preserve long-term trend analysis.
SafeWise publishes updates, follow-up analyses, and supplemental reports throughout the year as new data becomes available or as major events affect public safety sentiment.
2018
- First State of Safety survey was fielded
- 6 areas of safety were explored: Violent crime, property crime, digital security, health and wellness, environmental safety, workplace safety
2019
- First annual report published
- Second survey fielded
- Added questions about mass shootings
2020
- Narrowed focus to property and violent crime
- Introduced questions about gun violence beyond just mass shootings
2021
- Added questions about package theft, police violence, and the COVID-19 pandemic
- Began prioritizing a representative demographic sample (economic and racial/ethnic diversity)
2022
- Expanded focus to include natural disasters
- Added more depth to questions about package theft
- Included new questions about cybercrime
2023
- No survey was fielded in 2023; instead, perceptions were captured using reflective questions in our 2024 survey.
2024
- Added questions about cybersecurity practices and protections people are using
- Asked about concern levels around current political and social issues, including:
- The economy
- Immigration
- Gun control
- Gender
- Religion
2025
- No new topics added, the only adjustments made were to improve clarity on two questions from the 2024 survey
Find out more about our State of Safety research on our methodology page.
*No survey was fielded in 2023; instead, perceptions were captured using reflective questions in our 2024 survey.
Expert review and analysis
This report was reviewed by SafeWise data analysts and subject-matter experts, including specialists in crime trends, theft, and cybersecurity, to ensure accuracy, clarity, and appropriate interpretation of findings.
Rebecca Edwards
Managing Editor & Lead Safety Expert
Rebecca is the Managing Editor and Lead Safety Expert at SafeWise, where she oversees the editorial direction, accuracy, and interpretation of SafeWise’s original safety research. She specializes in crime trends, home and personal security, and translating complex safety data into clear, trusted insights for consumers, media, and policymakers.
Cathy Habas
Senior Writer, Family Safety & Data Projects
Cathy is a Senior Writer at SafeWise, focusing on family and personal safety, as well as data-driven research projects. Her work contributes to SafeWise’s annual reports and special studies, helping contextualize survey findings and safety trends for households and families across the U.S.
Daniel Delgado
Data Analyst, SafeWise
Danny is a data analyst at SafeWise, supporting the collection, analysis, and interpretation of proprietary survey data and crime trends, as well as external crime and safety data and trends. His work contributes to the State of Safety report, Safest Cities rankings, and ongoing state- and city-level safety analysis.
Ben Stickle, PhD
Criminologist & Expert Adviser/Reviewer
Dr. Ben Stickle is a criminologist and professor whose research focuses on crime trends, criminal behavior, and public safety. He serves as an expert reviewer for SafeWise’s safety research, providing subject-matter expertise and guidance on interpreting crime-related findings.
Recent Articles
The Best Fall Detection Devices
Find the best medical alert systems with fall detection. Compare equipment, price, accuracy, customer reviews,...

Jury Finds Meta and YouTube Negligent in Landmark Social Media Addiction Case
Meta and YouTube were found negligent in a landmark addiction case. Here’s why it matters...
How Safe Are the Fastest-Growing U.S. Cities?
Does a surge in population lead to a surge in crime? Find out in our...
Package Theft and Cybercrime Are Now the Most Common Crimes in America
State of Safety data shows Americans are more likely to experience package theft and cybercrime...