
See crime rates for the safest cities.
Colorado’s Safest Cities of 2026
For over 13 years, SafeWise experts have conducted independent research and testing to write unbiased, human reviews (not robots). Learn more.
Cathy has been a SafeWise contributor since 2021, helping turn crime data into clear, useful safety insights.

Here are the 10 Safest Cities in Colorado for 2026
Results from our latest State of Safety survey suggest Colorado is experiencing a sharp decline in property crime, but official statewide crime rates show a more modest decrease. More Coloradans feel safe in their state and believe crime is decreasing compared to the previous year's survey, but they still worry about overall crime more than the average American (48% CO, 46% US).
Compared to statewide and national averages, Colorado's top 10 safest cities have incredibly low crime rates. This year, Lamar leads the way.
In this report

Download the full list of cities in your state
Enter your email to get the full list with crime stats.
By signing up, you agree to our Terms and Conditions and Privacy Policy.
NOTE: If your city is missing from our full report, it means that it was below the population threshold or didn’t submit a complete crime report to the FBI in 2023.
Colorado crime rates and safety concerns
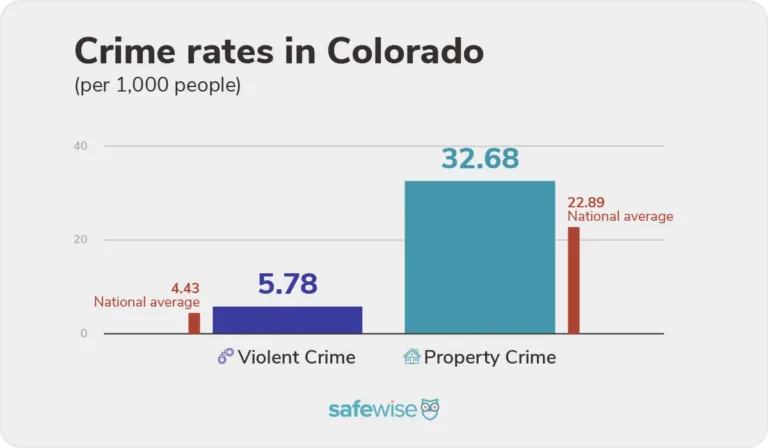
Bar chart comparing Colorado violent and property crime rates to national averages. Colorado is above average in both categories. Image: SafeWise
The violent crime rate in Colorado is 5.78 incidents per 1,000 people, which is higher than the national average of 4.43 and the eighth highest rate in the country. We weren't able to report a statewide violent crime rate last year due to insufficient data, but in our 2024 report, Colorado reported about the same violent crime rate — 5.8.
Property crime in The Centennial State has also held steady in recent years. It was 32.7 incidents per 1,000 people in 2024, and this year's property crime rate is 32.68. That's higher than the national property crime rate of 22.89 and the fourth-highest rate in the nation.
Despite higher than average crime rates, the percentage of Coloradans who feel safe in the state increased from 46% to 50% year over year. However, Coloradans still feel a little less safe than the average American (US 52%).
"My biggest concern is that crime seems to be making its way closer to where we live and we live in the country. I feel that I have to make sure everything is locked when we used to be able to leave at least windows open."
—Colorado resident*
—Colorado resident*
Property crime in Colorado: Fear vs. reality
According to our survey, property crime and package theft have seen impressive declines across The Centennial State.
- 19% of Coloradans said they experienced property crime in the 12 months prior to our survey, which is a significant decline from 37% the year before (21% US).
- Concern about property crime also plummeted from 65% to 47% year over year (46% US).
- 36% personally experienced a package theft in the 12 months prior to our survey, down from 47%. Although this is a promising decrease, it's still the seventh highest in incident rate in the nation (31% US).
- The percentage of Coloradans worried about package theft fell from 62% to 49% year over year (44% US).
- 32% of Coloradans told us they increased security measures in the 12 months prior to the survey.
- Of the Coloradans who use some form of property protection, 47% use security cameras, 40% use guard dogs, and 29% use security systems.
"Theft is a huge concern. People steal from your porch, your fenced-in backyard, anything that isn't attached to your house or locked up. It's awful."
—Colorado resident*
—Colorado resident*
Cyber crime in Colorado
For the second year in a row, we asked our State of Safety survey respondents about cyber security.
- Coloradans reported more cyber crime experiences than the average American (CO 33%, US 29%).
- Coloradans report the fifth-highest cyber crime incident rate in the nation.
- 65% of Coloradans worry about cyber crimes, which is down from 69% the previous year.
- 18% of Coloradans say they use an identity theft protection service, up from 15% the year before.
- 42% use a credit monitoring service (32% US).
- Coloradans are less likely to use anti-virus and anti-malware compared to the average American.
"My biggest concern is how to save my privacy while using the internet, and having my cards being used or getting my personal information while using a shopping app or website."
—Colorado resident*
—Colorado resident*
What security measures do Coloradans use most?
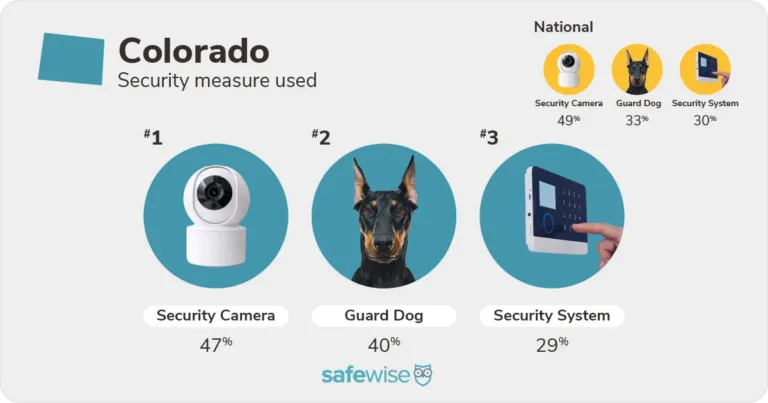
Top security measures used in Colorado (security cameras, guard dogs, and security systems) compared to national trends. Image: SafeWise
What crimes are Colorado residents concerned about most?
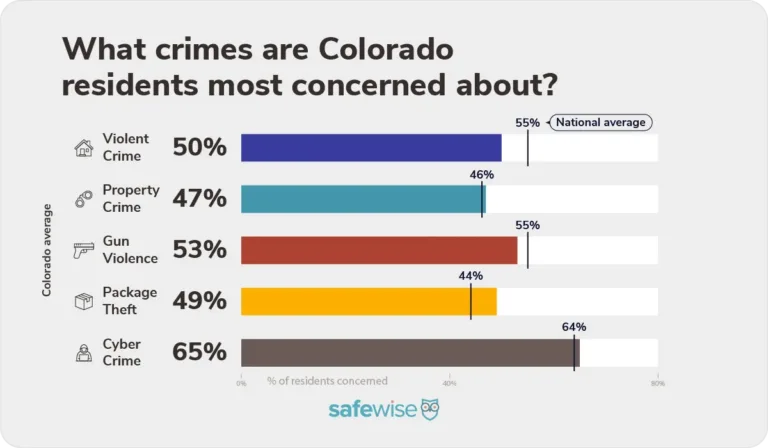
Bar chart showing the percentage of Colorado residents concerned about violent crime, property crime, gun violence, package theft, and cyber crime. Image: SafeWise
Violent crime in Colorado: Fear vs. reality
The percentage of Coloradans who experienced a violent crime in the 12 months prior to the survey stayed the same year over year, but concern about violent crime has dropped significantly.
- 50% of Coloradans worry about violent crime on a daily basis, down from 65% the previous year (US 55%).
- 13% of Coloradans say they experienced a violent crime first-hand, which is the same percentage as last year (12% US).
- 17% of Coloradans surveyed say crime is decreasing in their state (US 16%).
- 34% of Coloradans use some form of personal protection.
- Coloradans prefer to protect themselves with pocket knives (56%), pepper spray (47%), and firearms (35%).
"For myself personally, the biggest safety concern I currently face is transphobia."
—Colorado resident*
—Colorado resident*
Attitudes about gun violence in Colorado
- 53% of Coloradans are worried about gun violence, which represents a slight decrease from 55% the year before (55% US).
- 10% of Coloradans told us they had an experience with gun violence in the 12 months prior to the survey (9% US)—a 1 point increase year over year.
- 4 mass shooting events occurred in Colorado in 2025; 2 fewer than in 2024.
- Firearms are the third most used form of personal protection in Colorado, used by 35% of those who use any kind of personal protection (US 45%).
"I worry about my safety when I attend a large event like sports or concerts. These large crowds seem to be targets."
—Colorado resident*
—Colorado resident*
*Quotes collected from our State of Safety survey.
A closer look at the safest cities in Colorado
For the purposes of this report, the terms “dangerous” and “safest” refer explicitly to crime rates as calculated from FBI crime data—no other characterization of any community is implied or intended.
- 67 cities in Colorado met the criteria for ranking.
- The top three safest cities in Colorado each reported zero violent crimes: Lamar, Milliken, and Fruita.
- Every city in the top 10 reported no more than 1 violent crime per 1,000 people.
- Castle Rock is the most populous city on this year's list with more than 84,000 residents.
- 3 cities in the top 10 held on to their rankings from last year: Milliken (#2), Erie (#7), and Castle Rock (#8).
- 3 cities saw declines in both property and violent crime: Fruita, Eagle, and Erie.
- Fruita's property and violent crime rates have decreased two years in a row.
- Eagle decreased its violent crime rate by 50% and its property crime rate by about 36% year over year.
- Timnath's property crime rate dropped by about 41% year over year.
- 6 of the top 10 safest cities are located in suburbs around major cities like Fort Collins and Boulder. The other 4 cities are small towns located toward the state's eastern and western borders. Some, like Gypsum and Eagle, neighbor each other.
The 10 safest cities in Colorado
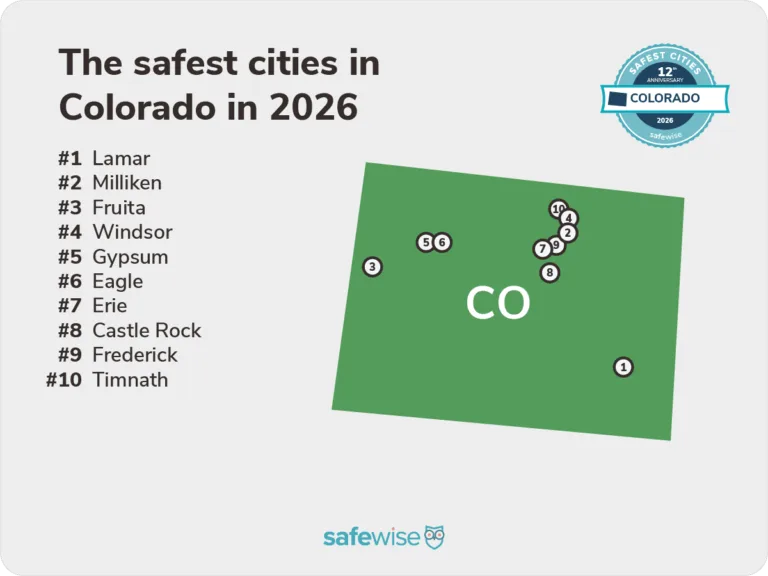
Map of the safest cities in Colorado for 2026, listing top 10 ranked cities based on SafeWise crime data. Image: SafeWise

#1
Lamar
(
NEW
)-
 Population7,468
 -
 VC Rate 2026, 2025, 20240, N/A, N/A
 -
 PC Rate 2026, 2025, 20245.2, N/A, N/A
 -
 VC=Violent crime, PC=Property crime
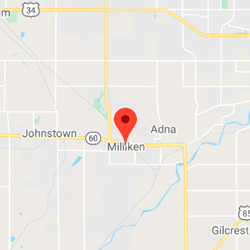
#2
Milliken
(
-0-
)-
Population9,303
-
VC Rate 2026, 2025, 20240.0, 0.1, 0.1
-
PC Rate 2026, 2025, 20245.4, 4.3, 4.1
-
VC=Violent crime, PC=Property crime
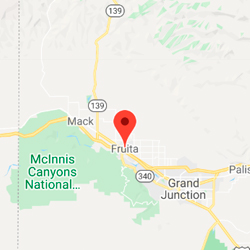
#3
Fruita
(
 )
)
+3
-
Population13,949
-
VC Rate 2026, 2025, 20240.0, 0.4, 1.2
-
PC Rate 2026, 2025, 20247.7, 10.0, 10.6
-
VC=Violent crime, PC=Property crime

#4
Windsor
(
 )
)
-1
-
Population43,050
-
VC Rate 2026, 2025, 20240.5, 0.4, 0.3
-
PC Rate 2026, 2025, 20245.4, 6.5, 5.8
-
VC=Violent crime, PC=Property crime
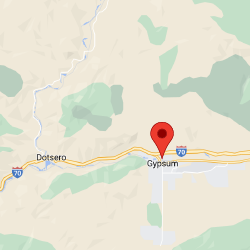
#5
Gypsum
(
)
-4
-
Population9,101
-
VC Rate 2026, 2025, 20241.0, 0.2, 1.0
-
PC Rate 2026, 2025, 20242.9, 2.7, 6.2
-
VC=Violent crime, PC=Property crime
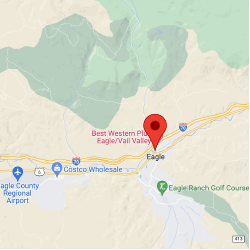
#6
Eagle
(
)
+4
-
Population7,354
-
VC Rate 2026, 2025, 20240.7, 1.4, N/A
-
PC Rate 2026, 2025, 20245.4, 8.4, N/A
-
VC=Violent crime, PC=Property crime

#7
Erie
(
-0-
)-
Population37,055
-
VC Rate 2026, 2025, 20240.3, 0.4, 0.2
-
PC Rate 2026, 2025, 20249.2, 10.0, 10.3
-
VC=Violent crime, PC=Property crime

#8
Castle Rock
(
-0-
)-
Population84,098
-
VC Rate 2026, 2025, 20240.3, 0.2, 0.2
-
PC Rate 2026, 2025, 20249.5, 12.2, 11.8
-
VC=Violent crime, PC=Property crime

#9
Frederick
(
)
-4
-
Population18,791
-
VC Rate 2026, 2025, 20240.8, 0.7, N/A
-
PC Rate 2026, 2025, 20246.4, 7.0, N/A
-
12.0, N/A, N/AVC=Violent crime, PC=Property crime

#10
Timnath
(
)
+1
-
Population11,404
-
VC Rate 2026, 2025, 20240.5, 0.5, 0.7
-
PC Rate 2026, 2025, 20249.1, 15.4, 12.6
-
VC=Violent crime, PC=Property crime
From rankings to real-world safety
Our Safest Cities rankings help highlight crime incidence patterns and relative risk — but they don’t determine what happens in a community or a home. How safe a community is (or isn't) is the result of a mix of individual choices, community conditions, and external factors like the economy, job market, housing availability, and local priorities.
Expand the sections below for a closer look at what you can do to help improve the safety of your community.
It's not possible to eliminate risk entirely, but you can reduce your potential risk by staying informed about local crime trends, practicing situational awareness (know who belongs in your neighborhood, work parking lot, etc.), and taking practical steps to protect yourself and your property.
Getting involved in your community can make a big difference — but you should expect certain baseline crime prevention measures from your neighborhood and city.
- Good lighting in public spaces
- Visible community law enforcement presence
- Neighborhood watch-type groups/support
- Access to a community liasion officer or department
- Budget to support community safety programs (beyond law enforcement)
Strong local networks — whether formal or informal (or in-person or virtual) — can play an essential role in improving safety beyond what statistics alone can capture.
Our research and national crime data consistently point to the value of layered prevention. This means that the more layers you put between your home and loved ones and criminals, the better chance you have of actually deterring a criminal act.
Multiple security layers can look like a neighborhood watch plan combined with locking your doors when you leave the house, and a security camera with a siren that can scare an intruder away. A monitored security system that connects you to faster help if something happens adds an extra proactive layer.
Research-backed practices that help reduce exposure include:
- Community prevention: Improved lighting, clear sightlines (trim hedges and bushes near doors/windows), and coordinated neighborhood efforts
- Awareness and reporting: Stay alert, trust your instincts, know who and what belongs in your neighborhood, and report suspicious behavior
- Home safety fundamentals: Secure all entry points (don't forget the deck or the sliding glass door), eliminate hiding spots around your home, and get into consistent security routines (locking the door, arming the security system)
- Targeted technology use: Pair common-sense safety habits with tools that support awareness or response, like monitored security systems or cameras
- Explore our safety research
- See crime trends by state
- Learn more about home security essentials
How we determine and interpret these rankings
Our Safest Cities rankings offer a data-informed look at crime trends across cities. They’re designed to highlight relative risk — not to define overall quality of life or what it’s like to live in a community.
We use the most recent FBI-reported violent and property crime data, and adjust for population so we can compare cities of different sizes fairly. This approach helps us identify patterns and differences in reported crime rates.
Our analysis includes only crime data from agencies that submitted complete reports to the FBI through the National Incident-Based Reporting System (NIBRS). We do not estimate crime totals for agencies with incomplete reporting, so our findings and crime rate trends may differ from reports that include estimated national crime data.
We understand that crime statistics reported to one source don’t tell the whole story. A number of factors, including local agency reporting practices, community resources, prevention efforts, and lived experience all influence how safe a place is (or is perceived to be) — and not all of that shows up in the numbers.
Think of these rankings as a starting point. Our goal is to help readers understand crime trends and ask informed questions, not to judge communities or the people who call them home.
Learn how we identified the safest cities on our methodology page.
Get a deeper understanding of our independent research, data sources, calculations, and how we refine our reports each year.
Related articles on SafeWise
Endnotes and sources
Find all endnotes and sources in our full methodology.
FBI Crime Data Explorer, "Documents & Downloads."
- 2024 Crime in the United States Annual Reports
- Offenses Known to Law Enforcement
- 2024 NIBRS Estimation Tables
Bureau of Justice Statistics, "National Incident-Based Reporting System (NIBRS)."
Gun Violence Archive, "Mass Shootings."
Safest Cities Badges:
Safest Cities badges are available at no charge for use by law enforcement agencies and city government. City government and law enforcement representatives should contact [email protected]
to inquire about badge usage.
To request a badge:
- Please put "Safest Cities badge request" in your subject line
- Include the name of your city and state
- Share the city government or law enforcement agency you represent
Badges are also available for licensing by other entities, including tourism boards, local businesses, and similar organizations. All other interested parties should contact our official partner, Wright’s Media, for information on available usages, license fees, and award seal artwork at [email protected].
Recent Articles

7 Best Home Security Systems of 2026 | Reviewed and Tested by Experts
Looking for the best home security systems of 2026? Our expert test and rank SimpliSafe...

What Is Geofencing, and Does It Work?
Learn how geofencing on kids smartwatches really works, including GPS accuracy limits, boundary sizes, notification...

mSpy Review — Is This Parental Control Software Right for You?
mSpy is a parental control app with powerful features, but is it the best solution...

Verizon Gizmo Watch Review
Our child safety expert compares the Verizon Gizmo Watch 3 and Gizmo Watch 3 Adventure....