
See crime rates for the safest cities.
Louisiana’s Safest Cities of 2026
For over 13 years, SafeWise experts have conducted independent research and testing to write unbiased, human reviews (not robots). Learn more.
Cathy has been a SafeWise contributor since 2021, helping turn crime data into clear, useful safety insights.

Here are the 10 Safest Cities in Louisiana for 2026
According to the latest FBI crime data, Louisiana sees some of the highest violent crime and property crime rates in the nation. But our State of Safety survey tells a different story, one where first-hand crime experiences are decreasing. Still, Louisiana residents remain wary of crime.
In this report

Download the full list of cities in your state
Enter your email to get the full list with crime stats.
By signing up, you agree to our Terms and Conditions and Privacy Policy.
NOTE: If your city is missing from our full report, it means that it was below the population threshold or didn’t submit a complete crime report to the FBI in 2023.
Louisiana crime rates and safety concerns
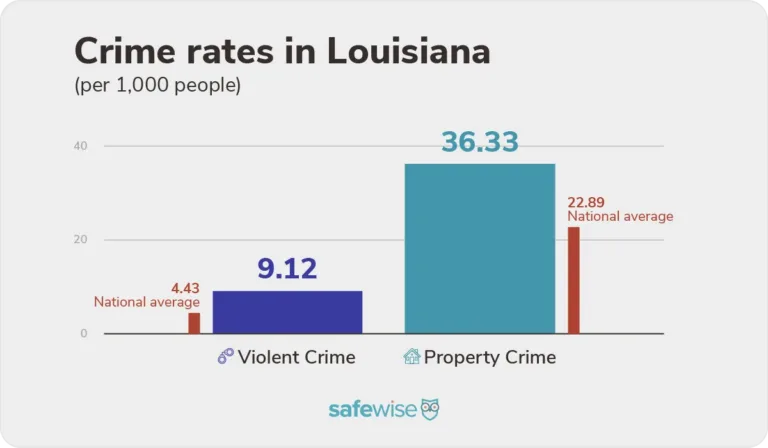
Bar chart comparing Louisiana violent and property crime rates to national averages. Louisiana is above average in both categories. Image: SafeWise
The violent crime rate in Louisiana is 9.12 incidents per 1,000 people, which is higher than the national average of 4.43. We weren't able to report a statewide violent crime rate last year due to insufficient data, but in our 2024 report, Louisiana reported a much lower violent crime rate of 5.1. Only Maryland reports a higher violent crime rate than Louisiana.
Property crime in The Pelican State has also increased in recent years, jumping from 29.96 incidents per 1,000 people in 2024 to 36.33 incidents in this year's report. That's higher than the national property crime rate of 22.89. Only New Mexico reports a higher property crime rate than Louisiana.
Given those high crime rates, it may come as no surprise to learn that only 34% of Louisianans say they feel safe in the state. That's the second lowest confidence level in the nation and represents a decrease from 36% in last year's report.
Daily concerns about overall safety increased year over year from 56% to 63%. Only Pennsylvania residents worry more (66%).
Property crime in Louisiana: Fear vs. reality
According to our State of Safety survey, Louisianans experienced less property crime compared to the previous year. However, concern about property crime is on the rise across The Pelican State.
- 55% of Louisiana respondents told us they're highly concerned about property crime, down from 63% the year before (US 46%).
- Reported experience with property crime dropped from 31% to 25% in our latest survey, but it's still higher than the national average of 21%.
- The percentage of Louisianans who worry about package theft increased slightly from 56% to 60% year over year, while the percentage of those who experienced package theft fell from 37% to 33%.
- 31% of Louisiana residents told us they increased their security or safety measures in the 12 months prior to our survey (US 32%).
- Louisiana residents prefer to protect their property with security cameras (53%), firearms (43%), and security systems (37%).
"My biggest safety concern last year was when someone threw a rock through my daughter's bedroom in the middle of the night and scared her half to death. My daughter still has nightmares. I still wonder if we will ever feel safe again."
—Louisiana resident*
—Louisiana resident*
Natural disaster concerns in Louisiana
Louisianans tend to worry about natural disasters more than the average American. This may not come as a surprise given the state's history of devastating hurricanes and floods.
- 80% of Louisianans expressed concern about Hurricanes—the second highest percentage in the country behind Florida (US 29%).
- 71% worry about floods—the highest percentage nationwide (US 40%).
- Louisiana residents are also among those who worry most about strong winds and extreme temperatures.
- 22% of Louisianans reported evacuating due to a natural disaster in the 12 months prior to our survey (US 9%).
What security measures are used most in Louisiana?
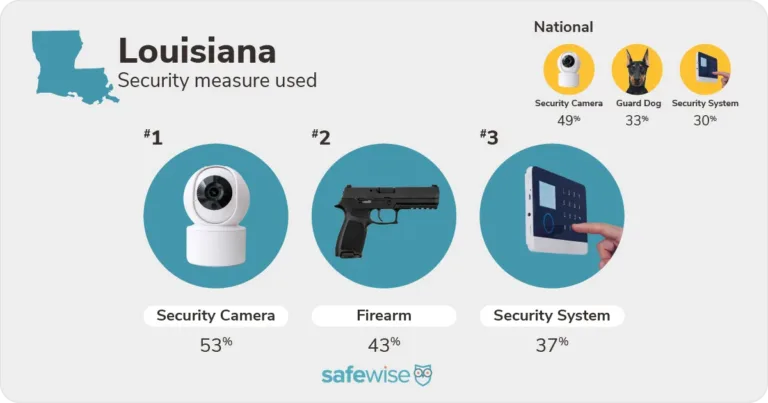
Top security measures used in Louisiana (security cameras, firearms, and security systems) compared to national trends. Image: SafeWise
What crimes are Louisiana residents concerned about most?
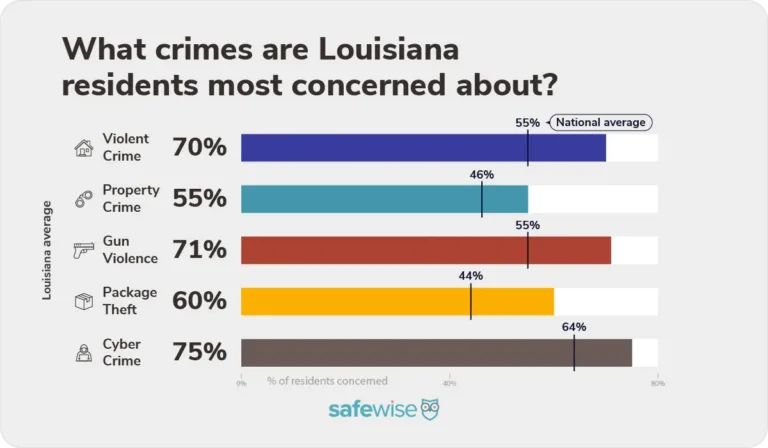
Bar chart showing the percentage of Louisiana residents concerned about violent crime, property crime, gun violence, package theft, and cyber crime. Image: SafeWise
Violent crime in Louisiana: Fear vs. reality
Concern about violent crime remains incredibly high in Louisiana. However, residents who took our State of Safety survey were less likely to have first-hand experience with violent crime compared to the previous year.
- 15% of survey respondents told us they had a personal experience with violent crime in the 12 months prior to the survey, down from 26% the year before (US 12%).
- 70% of Louisianans worry about violent crime, down from 71% the previous year (US 55%).
- Only Marylanders (74%) worry about violent crime more than Louisianans.
- 40% of Louisiana respondents use some form of personal protection.
- Louisianans prefer to protect themselves with firearms (55%), pocket knives (43%), and pepper spray (28%).
"The area I live in is very dangerous. I know many people who have gotten robbed, and I feel unsafe."
—Louisiana resident*
—Louisiana resident*
Attitudes about gun violence in Louisiana
- 71% of Louisianans worry about gun violence, which is the second highest percentage in the nation (US 55%). Only residents of Maryland and Illinois worry more.
- The percentage of Louisianans who worry about gun violence increased from 66% the previous year.
- 12% of Louisianans told us they had an experience with gun violence in the 12 months prior to the survey, down from 19% the previous year (US 9%).
- 16 mass shooting events occurred in Louisiana in 2025, a decrease from 21 in 2024.
"In my small town, all we hear about is people trying to follow or kidnap them at stores around town. Also, gang violence and shootings in certain parts of town."
—Louisiana resident*
—Louisiana resident*
*Quotes collected from our latest State of Safety survey.
A closer look at the safest cities in Louisiana
For the purposes of this report, the terms “dangerous” and “safest” refer explicitly to crime rates as calculated from FBI crime data—no other characterization of any community is implied or intended.
- 33 Louisiana cities met the criteria for ranking.
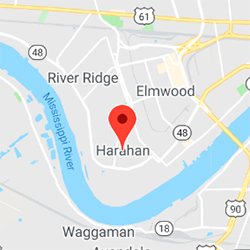
- Harahan, Louisiana's #1 safest city for 2026, has seen decreases in both violent crime and property crime for two years in a row.
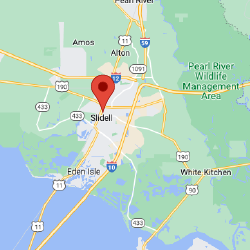
- Slidell also saw year-over-year decreases in both violent and property crime.
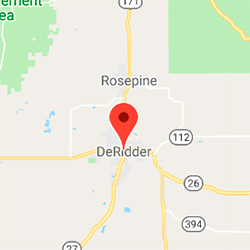
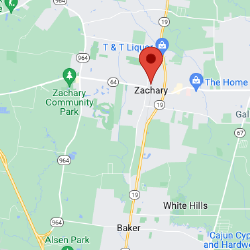
- Property crime rates decreased year-over-year in DeRidder, Baker, and Zachary, but violent crime rates in these towns either stayed the same or increased.
- Most of Louisiana's safest cities have crime rates that are lower than the national averages. The violent crime rate in Carencro matches the national average, and the property crime rate in Slidell is slightly higher than the national average.
- Most of the 10 safest cities in Louisiana are located in the southeast portion of the state around major cities like New Orleans, Baton Rogue, and Lafayette, as well as around the northeastern shores of Lake Pontchartrain.
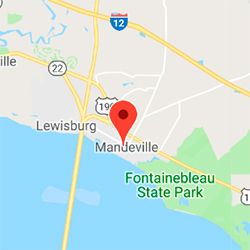
- Harahan, Mandeville, Broussard, and Carencro reported zero rapes.
The 10 safest cities in Louisiana
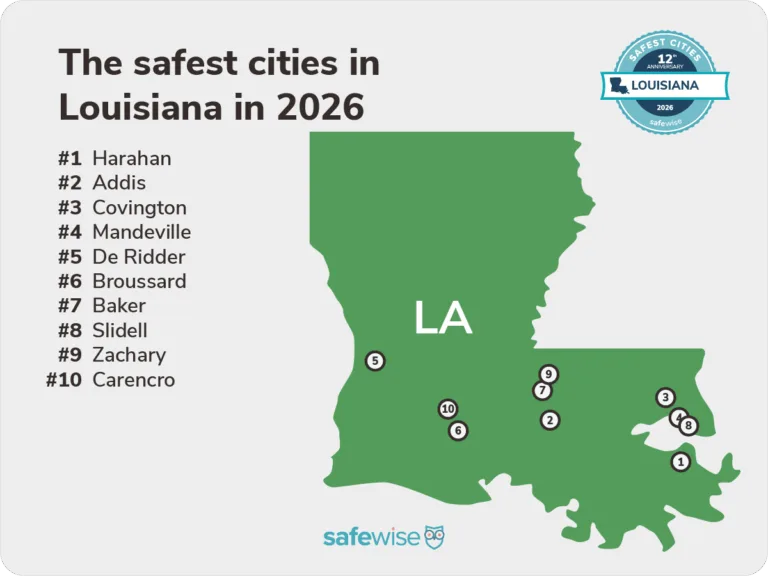
Map of the safest cities in Louisiana for 2026, listing top 10 ranked cities based on SafeWise crime data. Image: SafeWise
#1
Harahan
(
 )
)
+1
-
 Population8,596
 -
 VC Rate 2026, 2025, 20240.9, 1.6, 1.7
 -
 PC Rate 2026, 2025, 20247.6, 7.7, 8.9
 -
 VC=Violent crime, PC=Property crime

#2
Addis
(
 )
)
-1
-
Population7,797
-
VC Rate 2026, 2025, 20241.5, 0.3, 1.5
-
PC Rate 2026, 2025, 20247.1, 4.6, 4.4
-
VC=Violent crime, PC=Property crime
#3
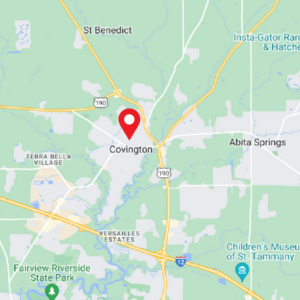
Covington
(
)
+2
-
Population11,641
-
VC Rate 2026, 2025, 20241.8, 1.6, 2.0
-
PC Rate 2026, 2025, 202410.2, 10.1, 9.4
-
VC=Violent crime, PC=Property crime
#4
Mandeville
(
)
+2
-
Population13,053
-
VC Rate 2026, 2025, 20241.3, 1.3, 1.7
-
PC Rate 2026, 2025, 202412.6, 12.4, 13.5
-
VC=Violent crime, PC=Property crime
#5
DeRidder
(
)
+2
-
Population9,517
-
VC Rate 2026, 2025, 20242.8, 2.5, 3.7
-
PC Rate 2026, 2025, 202415.1, 16.8, 15.8
-
VC=Violent crime, PC=Property crime
#6
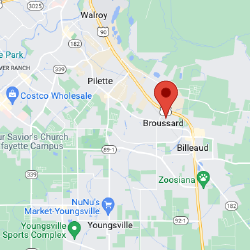
Broussard
(
)
+2
-
Population14,906
-
VC Rate 2026, 2025, 20241.8, 1.7, 3.0
-
PC Rate 2026, 2025, 202421.7, 20.0, 23.3
-
VC=Violent crime, PC=Property crime

#7
Baker
(
)
+3
-
Population11,933
-
VC Rate 2026, 2025, 20244.0, 4.0, 5.4
-
PC Rate 2026, 2025, 202418.0, 18.4, 23.2
-
VC=Violent crime, PC=Property crime
#8
Slidell
(
)
+4
-
Population28,449
-
VC Rate 2026, 2025, 20242.6, 3.1, 2.6
-
PC Rate 2026, 2025, 202423.0, 26.0, 28.5
-
VC=Violent crime, PC=Property crime
#9
Zachary
(
)
+2
-
Population20,142
-
VC Rate 2026, 2025, 20243.3, 3.3, 3.4
-
PC Rate 2026, 2025, 202421.9, 24.4, 20.7
-
VC=Violent crime, PC=Property crime

#10
Carenco
(
NEW
)-
Population13,985
-
VC Rate 2026, 2025, 20244.4, N/A, N/A
-
PC Rate 2026, 2025, 202420.3, N/A, N/A
-
VC=Violent crime, PC=Property crime
From rankings to real-world safety
Our Safest Cities rankings help highlight crime incidence patterns and relative risk — but they don’t determine what happens in a community or a home. How safe a community is (or isn't) is the result of a mix of individual choices, community conditions, and external factors like the economy, job market, housing availability, and local priorities.
Expand the sections below for a closer look at what you can do to help improve the safety of your community.
It's not possible to eliminate risk entirely, but you can reduce your potential risk by staying informed about local crime trends, practicing situational awareness (know who belongs in your neighborhood, work parking lot, etc.), and taking practical steps to protect yourself and your property.
Getting involved in your community can make a big difference — but you should expect certain baseline crime prevention measures from your neighborhood and city.
- Good lighting in public spaces
- Visible community law enforcement presence
- Neighborhood watch-type groups/support
- Access to a community liasion officer or department
- Budget to support community safety programs (beyond law enforcement)
Strong local networks — whether formal or informal (or in-person or virtual) — can play an essential role in improving safety beyond what statistics alone can capture.
Our research and national crime data consistently point to the value of layered prevention. This means that the more layers you put between your home and loved ones and criminals, the better chance you have of actually deterring a criminal act.
Multiple security layers can look like a neighborhood watch plan combined with locking your doors when you leave the house, and a security camera with a siren that can scare an intruder away. A monitored security system that connects you to faster help if something happens adds an extra proactive layer.
Research-backed practices that help reduce exposure include:
- Community prevention: Improved lighting, clear sightlines (trim hedges and bushes near doors/windows), and coordinated neighborhood efforts
- Awareness and reporting: Stay alert, trust your instincts, know who and what belongs in your neighborhood, and report suspicious behavior
- Home safety fundamentals: Secure all entry points (don't forget the deck or the sliding glass door), eliminate hiding spots around your home, and get into consistent security routines (locking the door, arming the security system)
- Targeted technology use: Pair common-sense safety habits with tools that support awareness or response, like monitored security systems or cameras
- Explore our safety research
- See crime trends by state
- Learn more about home security essentials
How we determine and interpret these rankings
Our Safest Cities rankings offer a data-informed look at crime trends across cities. They’re designed to highlight relative risk — not to define overall quality of life or what it’s like to live in a community.
We use the most recent FBI-reported violent and property crime data, and adjust for population so we can compare cities of different sizes fairly. This approach helps us identify patterns and differences in reported crime rates.
We understand that crime statistics reported to one source don’t tell the whole story. A number of factors, including local agency reporting practices, community resources, prevention efforts, and lived experience all influence how safe a place is (or is perceived to be) — and not all of that shows up in the numbers.
Think of these rankings as a starting point. Our goal is to help readers understand crime trends and ask informed questions, not to judge communities or the people who call them home.
Learn how we identified the safest cities on our methodology page.
Get a deeper understanding of our independent research, data sources, calculations, and how we refine our reports each year.
Related articles on SafeWise
Endnotes and sources
Find all endnotes and sources in our full methodology.
FBI Crime Data Explorer, "Documents & Downloads."
- 2024 Crime in the United States Annual Reports
- Offenses Known to Law Enforcement
- 2024 NIBRS Estimation Tables
Bureau of Justice Statistics, "National Incident-Based Reporting System (NIBRS)."
Gun Violence Archive, "Mass Shootings."
Safest Cities Badges:
Safest Cities badges are available at no charge for use by law enforcement agencies and city government. City government and law enforcement representatives should contact [email protected]
to inquire about badge usage.
To request a badge:
- Please put "Safest Cities badge request" in your subject line
- Include the name of your city and state
- Share the city government or law enforcement agency you represent
Badges are also available for licensing by other entities, including tourism boards, local businesses, and similar organizations. All other interested parties should contact our official partner, Wright’s Media, for information on available usages, license fees, and award seal artwork at [email protected].
Recent Articles

7 Best Home Security Systems of 2026 | Reviewed and Tested by Experts
Looking for the best home security systems of 2026? Our expert test and rank SimpliSafe...

What Is Geofencing, and Does It Work?
Learn how geofencing on kids smartwatches really works, including GPS accuracy limits, boundary sizes, notification...
mSpy Review — Is This Parental Control Software Right for You?
mSpy is a parental control app with powerful features, but is it the best solution...

Verizon Gizmo Watch Review
Our child safety expert compares the Verizon Gizmo Watch 3 and Gizmo Watch 3 Adventure....