The Safest Cities in Every State 2026
For over 13 years, SafeWise experts have conducted independent research and testing to write unbiased, human reviews (not robots). Learn more.
Cathy has been a SafeWise contributor since 2021, helping turn crime data into clear, useful safety insights.

Rebecca helps you stay safe without the stress | Managing Editor | 12+ yrs in home + personal security | 30+ yrs in journalism | Expertise featured by NYT, PBS, Today Show, and more
Find the safest city in every state for 2026
See which city topped the list in each state.
Everyone wants to feel safe at home. Whether you're checking in on your current city or scouting out a new one, we've crunched the numbers on crime rates across the country. Here's a look at the safest city in every state — did yours make the cut?
About our safest cities in the U.S. reports
The "safest" cities rankings are intended to highlight cities with low per capita crime rates and ignite conversation and action around how to make all cities and communities safer.
For the purposes of city ranking reports, the terms “dangerous” and “safest” refer explicitly to crime rates as calculated from FBI crime data—no other characterization of any community is implied or intended.
We analyze crime data each year to provide a clearer picture of safety across the country. While the nationwide crime rate estimates from the FBI have been inconsistent in recent years, we still look at the most reliable data available to identify trends.
National crime trends: 2026
- Property crime rate: 22.89 per 1,000 people (20% increase year over year)
- Violent crime rate: 4.43 per 1,000 people (23% increase year over year)
Even with reported overall increases in both violent and property crime, not all states followed the trend:
- 7 states reported lower rates of both violent and property crime
- 11 states saw a decrease in violent crime only
- 3 states experienced a drop in property crime only
- 1 state reported no changes in violent crime and property crime
While these numbers provide a broad perspective, we understand that crime trends can vary significantly by location — and reported crime data is just one measure that doesn't represent the overall safety of a community. By focusing on city-level crime data, we aim to give a more accurate and actionable look at safety in communities across the U.S.
We base our rankings on violent and property crime rates, calculated per 1,000 residents for a fair comparison. Cities must meet reporting and population criteria to be included, and some states may be excluded due to incomplete data.
It's not our intention to denigrate any community or to ignore real safety issues that may exist for residents in a town with a low per capita crime rate.
Beyond the numbers: Understanding safety trends
We understand that crime data, on its own, misses many nuances that contribute to safety — or the lack thereof. To provide deeper insight, we include findings from our annual State of Safety survey, launched in 2018. This research helps us understand how people feel about safety in their communities. It has evolved to address current and emerging trends like package theft, gun violence, and natural disasters. We also strive to collect a representative demographic sample of Americans.
Ultimately, our goal is to highlight cities with lower crime rates, spark conversations about perceptions of safety and community challenges, and offer potential solutions to help us all feel safer at home and in our communities.
A closer look at the safest cities in each state
The safest cities in each state have an average population of 13,684.
- Largest population: Columbus, Indiana (51,867 residents)
- Smallest population: Eddyville, Kentucky (2,483 residents)
In two states, the safest city had a violent crime rate of 0.0 and a property crime rate of 0.0.
Seven additional cities had a violent crime rate of 0.0:
- Eddyville, Kentucky
- Elgin, Oklahoma
- Strafford, New Hampshire
- Margaret, Alabama
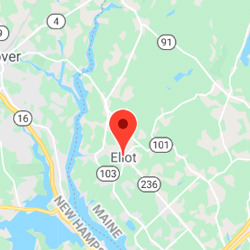
- Eliot, Maine
- Lamar, Colorado
- Vernon Township, New Jersey
The highest violent crime rate reported by a safest city was 1.8 incidents per 1,000 people in Sitka, Alaska.
The highest property crime rate reported by a safest city was 12.8 incidents per 1,000 people in Jamestown, North Dakota.
Most of the safest cities in each state reported zero murders. Three reported at least one:
In total, the safest cities reported 1,887 counts of larceny/theft — the most common type of crime. Four cities reported zero:
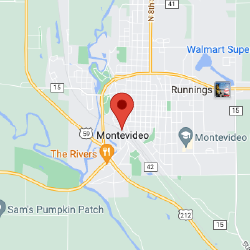
- Elko New Market and Montevideo, Minnesota (tie)
- Castleton, Vermont
- Columbus, Indiana
Burglaries/break-ins represent the second most common crime in the safest cities, totaling 343 incidents. Nine cities reported zero:
- Ridgefield, Connecticut
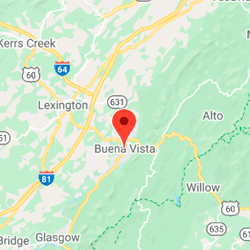
- Buena Vista, Virginia
- Broadview Heights, Ohio
- Senoia, Georgia
- New Martinsville, West Virginia
- Elgin, Oklahoma
- Kinross Township, Michigan
- Elko New Market, Minnesota and Montevideo, Minnesota (tie)
- Castleton, Vermont
About 73% of the safest cities in each state reported zero robberies, and 63% reported zero rapes. Just over half of the safest cities reported neither type of crime.
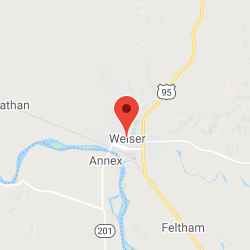
It's unusual for a city's violent crime rate to be higher than its property crime rate, but that's what happened in Weiser, Idaho. Eight violent crimes (all aggravated assaults) were reported compared to three property crimes (one burglary and two larcenies/thefts).
Some of the safest cities in each state have held on to their titles for several years in a row:
- West Linn, Oregon (7 years)
- Bristol, Rhode Island (7 years)
- Lone Peak (Alpine & Highland), Utah (5 years)
- Montevideo, Minnesota (4 years)
- Ridgefield, Connecticut (4 years)
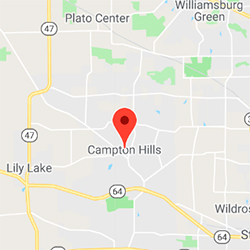
- Campton Hills, Illinois (3 years)
- Northborough, Massachusetts (3 years)
- Vernon Township, New Jersey (3 years)
- Mesquite, Nevada (3 years)
Most of the safest cities in each state reported a year-over-year decrease in at least one type of crime.
- 31% reported decreases in both property crime and violent crime.
- 23% reported a decrease in property crime and an increase in violent crime.
- 10% reported a decrease in violent crime and an increase in property crime.
- 14% reported an increase in both types of crime.
- 22% had no year-over-year data for comparison.
Some of those decreases have been quite dramatic:
- In the last two years, Sedro-Woolley, Washington decreased its violent crime rate by 85% and its property crime rate by 64%.
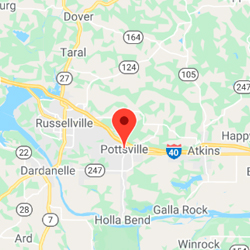
- Pottsville, Arkansas reported a 79% decrease in property crime over the last two years.
- Anthony, New Mexico saw its property crime rate decline by 63% in two years.
About 55% of the safest cities are considered suburbs of larger metropolitan areas. San Luis, Arizona is located on the U.S.-Mexico border, and Anthony, New Mexico is about 20 miles from the border.
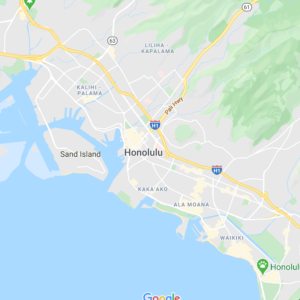
**Note: We didn't include Hawaii in the above findings because only one city in that state — Honolulu — reported crime data to the FBI. If we did include Honolulu, it would be the most populous city (992,973 residents), tie for the highest violent crime rate (1.8 incidents per 1,000 people), and have the highest property crime rate (17.3 incidents per 1,000 people).
The safest city in every state

-
 Population6,641
 -
 VC Rate 2026, 2025, 20240.0, N/A, 0.5
 -
 PC Rate 2026, 2025, 20241.2, N/A, 5.5
 -
 VC=Violent crime, PC=Property crime
See the rest of Alabama's Safest Cities.

-
Population8,306
-
VC Rate 2026, 2025, 20241.8, 2.3, 1.0
-
PC Rate 2026, 2025, 20246.9, 8.9, 4.3
-
VC=Violent crime, PC=Property crime
See the rest of Alaska's Safest Cities.

-
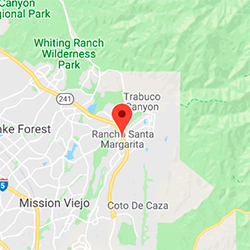
Population38,809
-
VC Rate 2026, 2025, 20240.9, N/A, N/A
-
PC Rate 2026, 2025, 20245.6, N/A, N/A
-
VC=Violent crime, PC=Property crime
See the rest of Arizona's Safest Cities.
-
Population3,330
-
VC Rate 2026, 2025, 20240.9, 0.6, 1.2
-
PC Rate 2026, 2025, 20241.8, 4.0, 8.4
-
VC=Violent crime, PC=Property crime
See the rest of Arkansas's Safest Cities.
-
Population42,814
-
VC Rate 2026, 2025, 20240.6, 0.8, N/A
-
PC Rate 2026, 2025, 20245.9, 7.4, N/A
-
VC=Violent crime, PC=Property crime
See the rest of California's safest cities.

-
Population7,468
-
VC Rate 2026, 2025, 20240.0, N/A, N/A
-
PC Rate 2026, 2025, 20245.2, N/A, N/A
-
VC=Violent crime, PC=Property crime
See the rest of Colorado's Safest Cities.

-
Population24,924
-
VC Rate 2026, 2025, 20240.2, 0.1, 0.0
-
PC Rate 2026, 2025, 20242.8, 2.0, 1.4
-
VC=Violent crime, PC=Property crime
See the rest of Connecticut's Safest Cities.

-
Population3,035
-
VC Rate 2026, 2025, 20240.7, N/A, N/A
-
PC Rate 2026, 2025, 20245.6, N/A, N/A
-
VC=Violent crime, PC=Property crime
See the rest of Delaware's Safest Cities.

-
Population17,622
-
VC Rate 2026, 2025, 20240.3, N/A, N/A
-
PC Rate 2026, 2025, 20242.7, N/A, N/A
-
VC=Violent crime, PC=Property crime
See the rest of Florida's safest cities.

-
Population6,263
-
VC Rate 2026, 2025, 20240.2, 0.2, 0.4
-
PC Rate 2026, 2025, 20242.1, 1.8, 3.6
-
VC=Violent crime, PC=Property crime
See the rest of Georgia's Safest Cities.
-
Population992,973
-
VC Rate 20261.8
-
PC Rate 202617.3
-
VC=Violent crime, PC=Property crime
See the State of Safety in Hawaii.
*Honolulu is the only city that submitted crime data to the FBI; there was not enough data to rank cities.
-
Population6,194
-
VC Rate 2026, 2025, 20241.3, 1.7, 1.3
-
PC Rate 2026, 2025, 20240.5, 1.8, 3.5
-
VC=Violent crime, PC=Property crime
See the rest of Idaho's Safest Cities.
-
Population10,768
-
VC Rate 2026, 2025, 20240.1, 0.0, 0.0
-
PC Rate 2026, 2025, 20240.5, 0.0, 0.1
-
VC=Violent crime, PC=Property crime
See the rest of Illinois's safest cities.

-
Population51,867
-
VC Rate 2026, 2025, 20240.1, 0.2, N/A
-
PC Rate 2026, 2025, 20240.8, 1.1, N/A
-
VC=Violent crime, PC=Property crime
See the rest of Indiana's Safest Cities.

-
Population8,643
-
VC Rate 2026, 2025, 20240.5, 0.1, 0.5
-
PC Rate 2026, 2025, 20240.8, 2.9, 2.6
-
VC=Violent crime, PC=Property crime
See the rest of Iowa's Safest Cities.

-
Population6,485
-
VC Rate 2026, 2025, 20240.2, 1.4, 0.8
-
PC Rate 2026, 2025, 20243.2, 3.6, 4.5
-
VC=Violent crime, PC=Property crime
See the rest of Kansas's Safest Cities.

-
Population2,483
-
VC Rate 2026, 2025, 20240.0, N/A, N/A
-
PC Rate 2026, 2025, 20240.8, N/A, N/A
-
VC=Violent crime, PC=Property crime
See the rest of Kentucky's Safest Cities.

-
Population8,596
-
VC Rate 2026, 2025, 20240.9, 1.6, 1.7
-
PC Rate 2026, 2025, 20247.6, 7.7, 8.9
-
VC=Violent crime, PC=Property crime
-
Population7,511
-
VC Rate 2026, 2025, 20240.0, 0.0, 0.1
-
PC Rate 2026, 2025, 20242.0, 1.8, 2.5
-
VC=Violent crime, PC=Property crime
See the rest of Maine's Safest Cities.

-
Population6,946
-
VC Rate 2026, 2025, 20240.1, 1.2, N/A
-
PC Rate 2026, 2025, 20241.0, 1.2, N/A
-
VC=Violent crime, PC=Property crime
See the rest of the Safest Cities in Maryland.

-
Population15,975
-
VC Rate 2026, 2025, 20240.1, 0.2, 0.3
-
PC Rate 2026, 2025, 20241.9, 0.9, 0.1
-
VC=Violent crime, PC=Property crime

-
Population6,490
-
VC Rate 2026, 2025, 20240.2, 0.0, N/A
-
PC Rate 2026, 2025, 20240.6, 0.8, N/A
-
VC=Violent crime, PC=Property crime
See the rest of Michigan's Safest Cities.
-
Population5,180
-
VC Rate 2026, 2025, 20240.0, 0.0, 0.0
-
PC Rate 2026, 2025, 20240.0, 0.0, 0.4
-
VC=Violent crime, PC=Property crime

-
Population5,126
-
VC Rate 2026, 2025, 20240.0, N/A, 0.2
-
PC Rate 2026, 2025, 20240.0, N/A, 3.0
-
VC=Violent crime, PC=Property crime

-
Population28,064
-
VC Rate 2026, 2025, 20240.5, 0.4, 0.5
-
PC Rate 2026, 2025, 20243.9, 6.3, 5.9
-
VC=Violent crime, PC=Property crime
See the rest of Mississippi's Safest Cities.
-
Population6,164
-
VC Rate 2026, 2025, 20240.2, 0.7, 0.2
-
PC Rate 2026, 2025, 20240.5, 1.9, 2.7
-
VC=Violent crime, PC=Property crime
See the rest of Missouri's Safest Cities.

-
Population3,306
-
VC Rate 2026, 2025, 20241.5, 1.5, N/A
-
PC Rate 2026, 2025, 20247.6, 8.3, N/A
-
VC=Violent crime, PC=Property crime
See the rest of Montana's Safest Cities.
-
Population6,879
-
VC Rate 2026, 2025, 20240.1, 0.6, 0.7
-
PC Rate 2026, 2025, 20247.6, 9.1, 11.2
-
VC=Violent crime, PC=Property crime
See the rest of Nebraska's Safest Cities.

-
Population23,559
-
VC Rate 2026, 2025, 20241.2, 1.9, 1.6
-
PC Rate 2026, 2025, 202410.1, 12.1, 13.4
-
VC=Violent crime, PC=Property crime
See the rest of Nevada's Safest Cities.

-
Population4,362
-
VC Rate 2026, 2025, 20240.0, N/A, 0.2
-
PC Rate 2026, 2025, 20241.1, N/A, 0.5
-
VC=Violent crime, PC=Property crime
-
Population22,851
-
VC Rate 2026, 2025, 20240.0, 0.1, 0.0
-
PC Rate 2026, 2025, 20241.7, 0.9, 1.5
-
VC=Violent crime, PC=Property crime
See the rest of New Jersey's safest cities.

-
Population8,733
-
VC Rate 2026, 2025, 20240.8, 2.1, 1.9
-
PC Rate 2026, 2025, 20242.4, 4.7, 6.5
-
VC=Violent crime, PC=Property crime
See the rest of New Mexico's safest cities.

-
Population16,094
-
VC Rate 2026, 2025, 20240.1, 0.1, N/A
-
PC Rate 2026, 2025, 20242.5, 4.5, N/A
-
VC=Violent crime, PC=Property crime
See the rest of New York's safest cities.
-
Population11,884
-
VC Rate 2026, 2025, 20240.3, 0.2, 0.9
-
PC Rate 2026, 2025, 20244.5, 3.9, 7.1
-
VC=Violent crime, PC=Property crime

-
Population15,651
-
VC Rate 2026, 2025, 20240.9, 1.9, 2.3
-
PC Rate 2026, 2025, 202412.8, 19.0, 20.2
-
VC=Violent crime, PC=Property crime
See the rest of North Dakota's Safest Cities.

-
Population19,709
-
VC Rate 2026, 2025, 20240.1, 0.2, 0.1
-
PC Rate 2026, 2025, 20241.0, 0.8, 1.4
-
VC=Violent crime, PC=Property crime
See the rest of Ohio's Safest Cities.

-
Population3,631
-
VC Rate 2026, 2025, 20240.0, 0.3, 0.0
-
PC Rate 2026, 2025, 20240.8, 0.8, 0.3
-
VC=Violent crime, PC=Property crime
See the rest of Oklahoma's Safest Cities.
-
Population26,382
-
VC Rate 2026, 2025, 20240.5, 0.4, 0.8
-
PC Rate 2026, 2025, 20248.1, 10.9, 11.3
-
VC=Violent crime, PC=Property crime
See the rest of Oregon's Safest Cities.

-
Population15,206
-
VC Rate 2026, 2025, 20240.3, 0.2, N/A
-
PC Rate 2026, 2025, 20242.2, 1.9, N/A
-
VC=Violent crime, PC=Property crime
See the rest of Pennsylvania's safest cities.
-
Population22,262
-
VC Rate 2026, 2025, 20240.3, 0.2, 0.5
-
PC Rate 2026, 2025, 20242.1, 2.6, 3.2
-
VC=Violent crime, PC=Property crime
See the rest of Rhode Island's Safest Cities.

-
Population14,456
-
VC Rate 2026, 2025, 20240.3, 0.2, 0.4
-
PC Rate 2026, 2025, 20243.0, 9.1, 10.8
-
VC=Violent crime, PC=Property crime

-
Population10,935
-
VC Rate 2026, 2025, 20240.7, N/A, 0.5
-
PC Rate 2026, 2025, 20244.5, N/A, 7.0
-
VC=Violent crime, PC=Property crime
See the rest of South Dakota's Safest Cities.
-
Population18,450
-
VC Rate 2026, 2025, 20240.5, 0.2, 0.8
-
PC Rate 2026, 2025, 20242.1, 2.3, 3.4
-
VC=Violent crime, PC=Property crime
See the rest of Tennessee's Safest Cities.

-
Population13,644
-
VC Rate 2026, 2025, 20240.1, 0.2, 0.4
-
PC Rate 2026, 2025, 20244.0, 3.9, 5.9
-
VC=Violent crime, PC=Property crime
See the rest of Texas's Safest Cities.

-
Population30,812
-
VC Rate 2026, 2025, 20240.3, 0.1, 0.2
-
PC Rate 2026, 2025, 20241.7, 2.8, 3.8
-
VC=Violent crime, PC=Property crime
See the rest of Utah's Safest Cities.
-
Population4,441
-
VC Rate 2026, 2025, 20240.0, 0.2, N/A
-
PC Rate 2026, 2025, 20240.0, 0.5, N/A
-
VC=Violent crime, PC=Property crime
See the rest of Vermont's Safest Cities.
-
Population6,598
-
VC Rate 2026, 2025, 20240.5, 1.1, 1.5
-
PC Rate 2026, 2025, 20243.3, 3.2, 7.4
-
VC=Violent crime, PC=Property crime
See the rest of Virginia's Safest Cities.

-
Population13,103
-
VC Rate 2026, 2025, 20240.2, 0.3, 1.3
-
PC Rate 2026, 2025, 20246.9, 10.6, 19.3
-
VC=Violent crime, PC=Property crime
See the rest of Washington's Safest Cities.

-
Population5,049
-
VC Rate 2026, 2025, 20240.6, N/A, N/A
-
PC Rate 2026, 2025, 20240.8, N/A, N/A
-
VC=Violent crime, PC=Property crime
-
Population18,035
-
VC Rate 2026, 2025, 20240.4, 0.3, 0.1
-
PC Rate 2026, 2025, 20242.3, 2.9, 1.4
-
VC=Violent crime, PC=Property crime
See the rest of Wisconsin's Safest Cities.

-
Population6,472
-
VC Rate 2026, 2025, 20240.6, 1.2, 1.9
-
PC Rate 2026, 2025, 20249.1, 14.2, 9.3
-
VC=Violent crime, PC=Property crime
See the rest of Wyoming's Safest Cities.
Safest cities by state
Check out the top safest cities in each state. Click on the state or select it from the drop down below.
Recent Articles