Is your small town one of the safest in the country?
100 Safest Small Towns in America 2019
Why you can trust SafeWise
products considered
250+
research hours in 25+ in-home tests
10k+
years of combined experience
176+
homes and people protected
10M+
For over 13 years, SafeWise experts have conducted independent research and testing to write unbiased, human reviews (not robots). Learn more.
Small towns may bring to mind white picket fences, baseball, and Grandma’s apple pie. They evoke nostalgia for a simpler time when the streets were safe and people rarely (if ever) locked their doors.
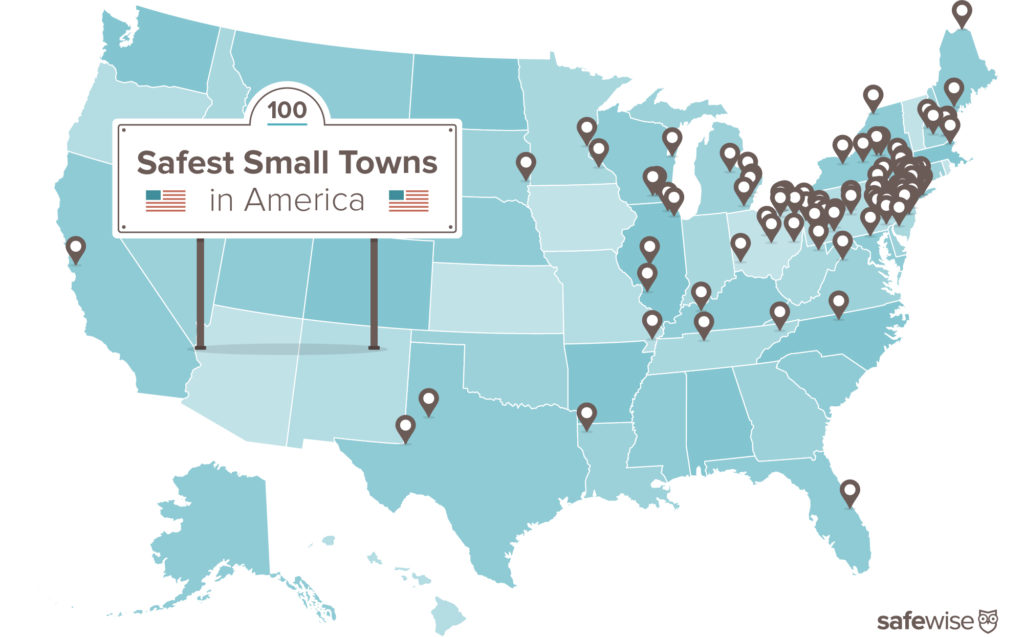
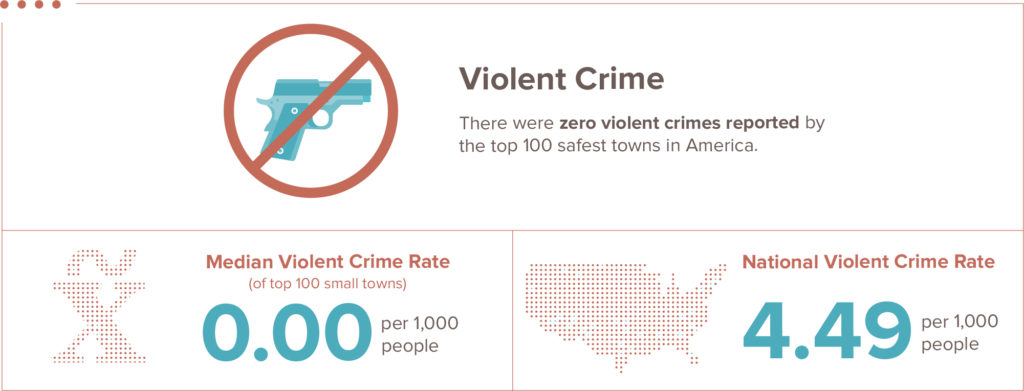
While some of those sepia-tinted ideas have faded away (and several small towns are close neighbors to sprawling metro areas), the notion of safety in small towns is alive and well. Our list of the 100 safest small towns in America is all the proof you need—not one violent crime was reported among all the cities that made our list.
Why Look at Safety in Small Towns?
As part of our never-ending quest to provide the most comprehensive and current safety-related resources, we expanded our Safest Cities in America series to examine safety in cities of differing sizes.
In the past, we lumped these smaller communities in with our overall 100 Safest Cities in America—but we decided to pull them out this year and take a closer look at safety in cities with 2,500 to 15,000 residents.
Six of these smaller towns were recognized last year, including Lewisboro Town, New York, which was the safest city in the country in 2018. Lewisboro held on to its number one ranking this year, but as the safest town among other cities of comparable size.
A Closer Look at Crime in America’s Safest Small Towns
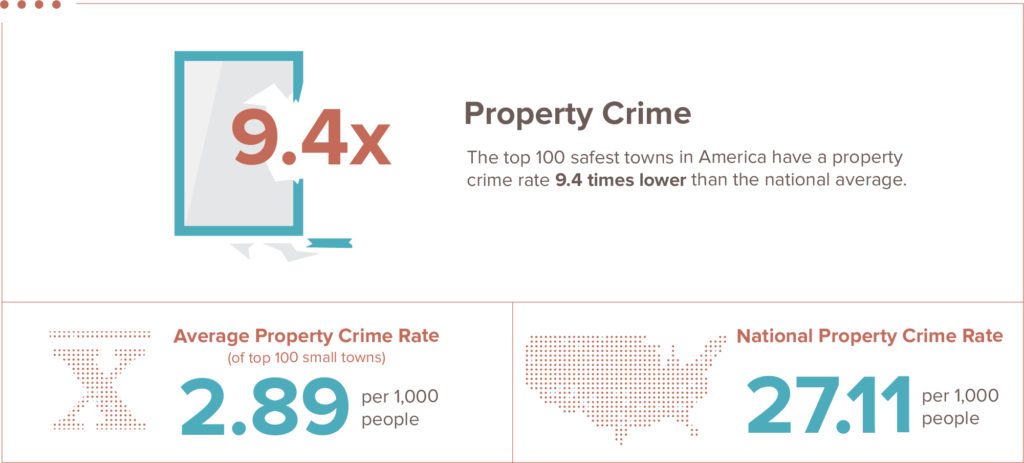
On top of a completely clean record for violent crime, 97% of these towns reported fewer than 50 property crimes. The city with the highest property crime rate is Baltimore, Ohio, with 5.38 incidents per 1,000 people (compared to 27.11 nationally). And the top five cities each reported just one property crime.
Every region of the country is represented by the safest small towns, but just barely. The West had only one town make the top 100—Monte Sereno, California, which sits at number 52 on our list. Nearly half of the country is home to one of America’s safest small towns, with 24 states making a showing. Pennsylvania has the highest number of safe small towns with 19, and New Jersey is a close second with 18.
Key Findings about America’s Safest Small Towns
Cities That Made Last Year’s 100 Safest Cities in America
- All 100 towns had zero incidents of violent crime, but there were no towns with zero incidents of property crime.
- Property crimes ranged from one to 61, with 97 towns reporting fewer than 50.
- Although the top five cities all reported one property crime, Lewisboro Town had the lowest property crime rate at 0.08 incidents per 1,000 people.
- Ohio was home to both the highest property crime rate (5.38 in Baltimore) and the highest number of reported property crimes (61 in Montville Township).
- 91% of the cities had fewer than five property crimes occur per 1,000 people.
- 31% had fewer than two property crime incidents per 1,000 people.
- The South is home to 11 of the safest small towns, and the Midwest claims 26.
- The majority of the cities (72) are above the national median income of $57,652.¹
- 34 cities have a median household income over $100,00 a year and three are more than $200,000.
- 14% of the cities have median household incomes below $50,000. Both Mahanoy City, Pennsylvania, and Portageville, Missouri, have median household incomes below $30,000.
- New York is home to the most affluent cities on our list—Bronxville Village, Oyster Bay Cove Village, and Sands Point Village each have median household incomes over $200,000.
- Fewer people doesn’t always equal less crime—just 7% of the towns on our list come from states with lower population density. On the other hand, 67% come from the top ten states for population density.
- New Jersey is number one in the country for population density and has the second-highest number of safe small towns.
- Twelve of the states represented are in the top 50% of the country for high poverty rates. Interestingly, both the most impoverished state (Louisiana) and the least (New Hampshire) are home to some of the nation’s safest small towns.
America's 100 Safest Towns
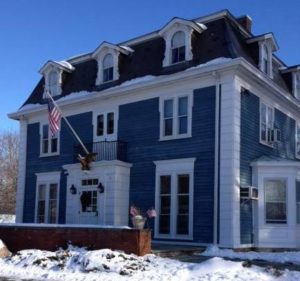
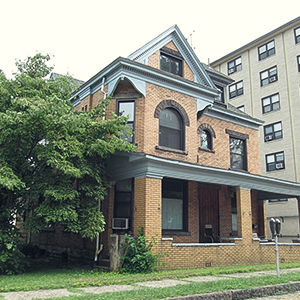
#1 Safest Town
Lewisboro Town, New York
(
New
)-
 Population12,823
 -
 Median Income$148,824
 -
 Image SourceFacebook @TownofLewisboro
 -
 Violent Crime Rate (per 1,000)0.000
 -
 Property Crime Rate (per 1,000)0.08
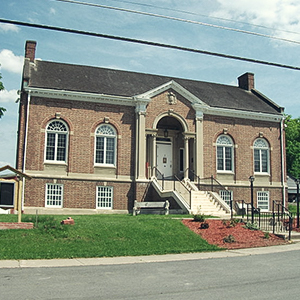
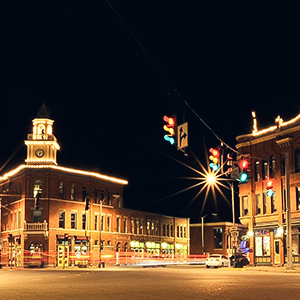
#2
Norfolk Town, New York
(
New
)-
Population4,447
-
Median Income$47,137
-
Image SourceWikipedia, Hepburn Library Norfolk, NY
-
Violent Crime Rate (per 1,000)0.000
-
Property Crime Rate (per 1,000)0.22
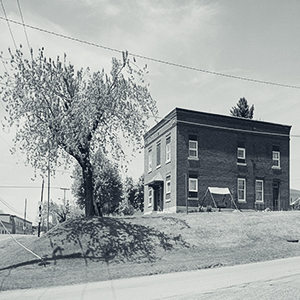
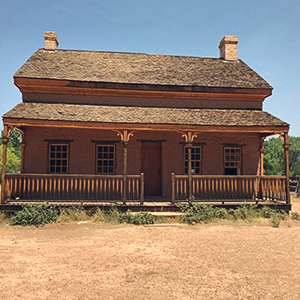
#3
Erie Township, Michigan
(
New
)- Population4,359
- Median Income$59,799
-
Image SourceWikipedia, Erie Township, MI
- Violent Crime Rate (per 1,000)0.000
- Property Crime Rate (per 1,000)0.23
#4
Shade Township, Pennsylvania
(
New
)- Population2,611
- Median Income$46,384
-
Image SourceWikipedia, Shade Township, Somerset County, Pennsylvania
- Violent Crime Rate (per 1,000)0.00
- Property Crime Rate (per 1,000)0.38
#5
Derry, Pennsyvlania
(
New
)-
Population2,551
-
Median Income$49,950
-
Image SourceWikipedia, Derry, Pennsylvania
-
Violent Crime Rate (per 1,000)0.00
-
Property Crime Rate (per 1,000)0.39

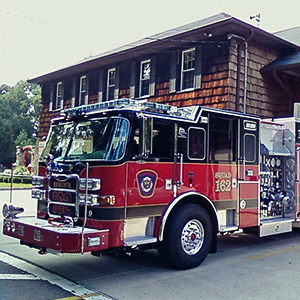
#6
New Hanover Township, New Jersey
(
New
)-
Population8,264
-
Median Income$83,646
-
Image SourceNew Hanover Twp Pto
-
Violent Crime Rate (per 1,000)0.00
-
Property Crime Rate (per 1,000)0.48

#7
Perry Township, Columbiana County, Ohio
(
New
)-
Population4,381
-
Median Income$68,403
-
Image SourceFacebook @PerryTownshipSchools
-
Violent Crime Rate (per 1,000)0.00
-
Property Crime Rate (per 1,000)0.68
#8
Mount Hope Town, New York
(
New
)-
Population6,904
-
Median Income$81,722
-
Image SourceFacebook @MountHopeNY
-
Violent Crime Rate (per 1,000)0.00
-
Property Crime Rate (per 1,000)0.72
#9
Pawnee, Illinois
(
New
)-
Population2,685
-
Median Income$63,889
-
 Image SourceFacebook @villageofpawnee
 -
Violent Crime Rate (per 1,000)0.00
-
Property Crime Rate (per 1,000)0.74
#10
Chester Township, Ohio
(
New
)-
Population10,355
-
Median IncomeN/A
-
Image SourceFacebook @WestChesterOH
-
Violent Crime Rate (per 1,000)0.00
-
Property Crime Rate (per 1,000)0.77
#11
Jefferson Township, Pennsylvania
(
New
)-
Population3,659
-
Median Income$56,204
-
Image SourceFacebook @jefftownshippa
-
Violent Crime Rate (per 1,000)0.00
-
Property Crime Rate (per 1,000)0.82
#12
Fulton, Wisconsin
(
New
)-
Population3,348
-
Median Income$76,815
-
Image SourceWikipedia, Fulton, WI
-
Violent Crime Rate (per 1,000)0.00
-
Property Crime Rate (per 1,000)0.90
#13
Milton Town, Wisconsin
(
New
)-
Population3,080
-
Median Income$73,482
-
Image SourceFacebook @townofmiltonwi
-
Violent Crime Rate (per 1,000)0.00
-
Property Crime Rate (per 1,000)0.97
#14
Mahanoy City, Pennsylvania
(
New
)-
Population3,981
-
Median Income$27,295
-
Image SourceFacebook @MC5FD
-
Violent Crime Rate (per 1,000)0.00
-
Property Crime Rate (per 1,000)1.00

#15
Mendham Township, New Jersey
(
New
)-
Population5,883
-
Median Income$185,882
-
Image SourceFacebook @TownshipofMendham
-
Violent Crime Rate (per 1,000)0.00
-
Property Crime Rate (per 1,000)1.02

#16
Tuxedo Town, New York
(
New
)-
Population2,927
-
Median Income$104,625
-
Image SourceFacebook @TuxedoHistorialSociety
-
Violent Crime Rate (per 1,000)0.00
-
Property Crime Rate (per 1,000)1.02
#17
South Pymatuning Township, Pennsylvania
(
New
)-
Population2,587
-
Median Income$65,781
-
Image SourceWikipedia, South Pymatuning Township
-
Violent Crime Rate (per 1,000)0.00
-
Property Crime Rate (per 1,000)1.16

#18
North Beaver, Pennsylvania
(
New
)-
Population3,957
-
Median Income$57,143
-
Image SourceFacebook @NorthBeaverVFD
-
Violent Crime Rate (per 1,000)0.00
-
Property Crime Rate (per 1,000)1.26

#19
Easton, Connecticut
(
New
)-
Population7,570
-
Median Income$136,786
-
Image SourceFacebook @eastonctpolice
-
Violent Crime Rate (per 1,000)0.00
-
Property Crime Rate (per 1,000)1.32
#20
Ford City, Pennsylvania
(
New
)-
Population2,825
-
Median Income$32,070
-
Image Sourcewikimedia commons
-
Violent Crime Rate (per 1,000)0.00
-
Property Crime Rate (per 1,000)1.42
#21
Hamilton Village, New York
(
New
)-
Population4,105
-
Median Income$65,150
-
Image SourceFacebook @ThisIsHamilton, NY
-
Violent Crime Rate (per 1,000)0.00
-
Property Crime Rate (per 1,000)1.46
#22
Grafton, West Virginia
(
New
)-
Population5,121
-
Median Income$31,627
-
Image SourceGrafton, west virginia
-
Violent Crime Rate (per 1,000)0.00
-
Property Crime Rate (per 1,000)1.56

#23
Ryan Township, Pennsylvania
(
New
)-
Population2,528
-
Median Income$65,268
-
Image Sourcewikimedia commons
-
Violent Crime Rate (per 1,000)0.00
-
Property Crime Rate (per 1,000)1.58

#24
Campton Hills, Illinois
(
New
)-
Population11,342
-
Median Income$131,658
-
Image SourceFacebook @vlgcamptonhills
-
Violent Crime Rate (per 1,000)0.00
-
Property Crime Rate (per 1,000)1.59
#25
Haworth, New Jersey
(
New
)-
Population3,491
-
Median Income$170,417
-
Image Source@chief152 Haworth Volunteer Fire Dept, NJ
-
Violent Crime Rate (per 1,000)0.00
-
Property Crime Rate (per 1,000)1.72
Looking For Your City?
Don’t see your state listed? Click on the state image below to check out our “Safest City” winners for each state.
How We Picked the Safest Small Towns in America
To kick off our first-ever Safest Small Towns in America ranking, we looked at FBI crime report data and population information for 2017 (the most recent year for which complete data was available).²
We excluded towns with populations below 2,500 and above 15,000. Because cities with populations under 2,500 are considered rural by census definitions, we decided to rule them out of this study. Our maximum threshold was determined by the national median population, which is 15,000. Cities outside those population parameters and those that failed to report complete crime data to the FBI were excluded.
We were a little surprised to find out that every city on this list reported zero incidents of violent crime (aggravated assault, murder, rape, and robbery) in 2017. So we based our rankings on the number of property crimes (burglary, arson, larceny-theft, and motor vehicle theft) that occurred per 1,000 people in each town. Although it didn’t impact rankings, we also examined population density, poverty rates, and median income. This data was used to provide insight into why some cities or states may be more likely to land on a safest cities list, and which might be outliers.
For more safe city data, check out our list of the 100 Safest Cities in America, and watch for our ranking of the safest (and most dangerous) metro areas—coming soon. Get all the details about how we rank the safest cities in our full methodology.
How to Make a Safe Home Anywhere
Wherever you live, feeling safe in your home can bring greater peace of mind and happiness. Whether your city made our list or not, we recommend adding extra security to your home with monitored security services provided by the nation’s leading home security providers.
Sources:
- United States Census Bureau, American FactFinder, “Community Facts”
- FBI, Uniform Crime Reporting, “2017 Crime in the United States”
Recent Articles

Best Smoke Detectors of 2026
We reviewed the top fire and smoke alarms for your home in 2026. Protect your...

The Best Alexa-Compatible Home Security Systems
Best for built-in integration ADT Voice control of ADT system Works with Alexa Guard View...

Vivint App: A Complete Guide to Features and Use
Tour the Vivint app and discover its features, navigation, and customization capabilities. Learn how to...

Dangerous Apps for Kids: What Parents Need to Know in 2026
Dangerous apps for kids include ones you’ve heard of (TikTok, Instagram) and some new arrivals....