20 Cities With the Most Severe Increases in Crime

For over 13 years, SafeWise experts have conducted independent research and testing to write unbiased, human reviews (not robots). Learn more.

Cathy Habas
Mar 03, 2026
Icon Time To Read5 min read
Icon CheckEdited ByRebecca Edwards
Icon CheckData Analysis ByDaniel Delgado

Cathy has been a SafeWise contributor since 2021, helping turn crime data into clear, useful safety insights.

Crime rates often fluctuate from year to year — even in America's safest cities. But some communities have been experiencing rapid increases in crime.

Using the latest FBI data, Safewise assigned more than 3,600 U.S. cities a unique safety score based on per-capita crime rates. The 20 cities in this report saw the most dramatic year-over-year decreases in their safety scores. These are not necessarily the cities with the worst crime rates, but rather cities with significant, fast-paced increases in crime. 

The top 20 cities are scattered across the U.S. and represent diverse locations — metros, suburbs, and small rural towns. However, many of the top 20 cities are concentrated around the Midwest — Missouri in particular — and the South. Interestingly, the top 20 most improved cities also included many Southern and Midwestern states.

Here are the top 10 cities with the worst safety score declines of 2026

See if your city made the full list.

Top 5 cities with the worst safety score declines

A map of the top 5 U.S. cities with the worst safety score declines based on our proprietary scoring and ranking system. Image: SafeWise


Why it's worth spotlighting rapid decline

For the purposes of this report, the terms “dangerous” and “safest” refer explicitly to crime rates as calculated from FBI crime data—no other characterization of any community is implied or intended.

Each year, SafeWise releases its annual Safest Cities rankings, highlighting communities with the lowest violent and property crime rates in every state. But low crime is only part of the public safety story.

It's just as important to look at where crime is changing — and how. Low crime is admirable and often hard-won, but getting there looks a little different in every community. Tracking positive and negative changes offers an opportunity to learn what's working and what isn't. 

National crime trends: A mixed picture

To determine this year’s cities with the worst safety score declines, we analyzed FBI crime data covering calendar year 2024 and compared it to the prior reporting year.

The average U.S. city saw a slightly improved safety score, increasing by 0.39 points. Most of that improvement came from declining property crime rates, which were down by 4% on average. Violent crime, on the other hand, increased by an average of 7%.

The cities in this report saw their safety scores drop by 8.2 to 20.8 points. Some reported triple-digit percentage increases. In most cases, violent crime increased more than property crime, which somewhat mirrors the national trend. 

Regional trends: Where rapid increases are concentrated

This year’s results reveal an interesting geographical trend. One in four cities are located in or near Missouri.

  • Two cities are suburbs of St. Louis, MO: Berkeley, MO and Vinita Park, MO.
  • Two cities are located outside of Kansas City, MO: Independence, MO and Lawrence, KS.
  • Blytheville, AR is located on the border with Missouri.

Several other cities are suburbs of major metros:

All other cities are located away from major metropolitan areas, typically in the Midwest and South. The Pacific Northwest and New England are the only regions not represented in the top 20. 


The top 20 cities with the worst safety score declines of 2026

VC= Violent crime, PC=Property crime; Crime rates per 1,000 people

#1
Highland Park, MI
(
20.8 points
Down
)
  • Circle Population
    Population
    8,280
  • Circle Gun
    VC Rate 2026, 2025
    29.8, 17.6 (69%↑)
  • Circle Property
    PC Rate 2026, 2025
    44.0, 37.4 (18%↑)
#2
Florida City, FL
(
16.5 points
Down
)
  • Circle Population
    Population
    12,441
  • Circle Gun
    VC Rate 2026, 2025
    22.7, 16.8 (35%↑)
  • Circle Property
    PC Rate 2026, 2025
    80.9, 58.6 (38%↑)
#3
Bastrop, LA
(
14.4 points
Down
)
  • Circle Population
    Population
    8,792
  • Circle Gun
    VC Rate 2026, 2025
    14.6, 7.4 (98%↑)
  • Circle Property
    PC Rate 2026, 2025
    48.7, 43.1 (13%↑)
#4
Berkeley, MO
(
13.7 points
Down
)
  • Circle Population
    Population
    7,970
  • Circle Gun
    VC Rate 2026, 2025
    25.2, 18.9 (33%↑)
  • Circle Property
    PC Rate 2026, 2025
    64.4, 50.4 (28%↑)
#5
Roseville, MN
(
13.2 points
Down
)
  • Circle Population
    Population
    35,507
  • Circle Gun
    VC Rate 2026, 2025
    4.0, 2.7 (48%↑)
  • Circle Property
    PC Rate 2026, 2025
    85.0, 57.7 (47%↑)
#6
Blytheville, AR
(
13.1 points
Down
)
  • Circle Population
    Population
    12,354
  • Circle Gun
    VC Rate 2026, 2025
    13.5, 7.0 (93%↑)
  • Circle Property
    PC Rate 2026, 2025
    43.6, 37.9 (15%↑)
#7
Independence, MO
(
12.9 points
Down
)
  • Circle Population
    Population
    120,271
  • Circle Gun
    VC Rate 2026, 2025
    5.1, 1.9 (177%↑)
  • Circle Property
    PC Rate 2026, 2025
    35.4, 13.2 (168%↑)
#8
Elmira, NY
(
12.6 points
Down
)
  • Circle Population
    Population
    26,130
  • Circle Gun
    VC Rate 2026, 2025
    5.5, 3.2 (70%↑)
  • Circle Property
    PC Rate 2026, 2025
    41.8, 14.7 (185%↑)
#9
Alexandria, LA
(
12.5 points
Down
)
  • Circle Population
    Population
    42,933
  • Circle Gun
    VC Rate 2026, 2025
    27.1, 19.6 (38%↑)
  • Circle Property
    PC Rate 2026, 2025
    67.5, 65.4 (3%↑)
#10
Globe, AZ
(
11.6 points
Down
)
  • Circle Population
    Population
    7,156
  • Circle Gun
    VC Rate 2026, 2025
    8.1, 4.7 (72%↑)
  • Circle Property
    PC Rate 2026, 2025
    55.5, 40.0 (39%↑)
#11
Vinita Park, MO
(
11.5 points
Down
)
  • Circle Population
    Population
    8,727
  • Circle Gun
    VC Rate 2026, 2025
    17.4, 9.7 (80%↑)
  • Circle Property
    PC Rate 2026, 2025
    52.5, 60.0 (13%↓)
#12
Huntsville, AL
(
11.3 points
Down
)
  • Circle Population
    Population
    228,697
  • Circle Gun
    VC Rate 2026, 2025
    4.8, 1.3 (268%↑)
  • Circle Property
    PC Rate 2026, 2025
    24.1, 7.2 (232%↑)
#13
Dover, DE
(
11.1 points
Down
)
  • Circle Population
    Population
    40,087
  • Circle Gun
    VC Rate 2026, 2025
    10.1, 7.0 (45%↑)
  • Circle Property
    PC Rate 2026, 2025
    61.6, 46.0 (34%↑)
#14
La Junta, CO
(
9.7 points
Down
)
  • Circle Population
    Population
    6,942
  • Circle Gun
    VC Rate 2026, 2025
    5.0, 3.7 (37%↑)
  • Circle Property
    PC Rate 2026, 2025
    70.2, 52.7 (33%↑)
#15
Springdale, OH
(
9.7 points
Down
)
  • Circle Population
    Population
    11,096
  • Circle Gun
    VC Rate 2026, 2025
    4.7, 2.7 (75%↑)
  • Circle Property
    PC Rate 2026, 2025
    34.2, 15.2 (126%↑)
#16
Lawrence, KS
(
9.2 points
Down
)
  • Circle Population
    Population
    96,636
  • Circle Gun
    VC Rate 2026, 2025
    4.4, 1.6 (170%↑)
  • Circle Property
    PC Rate 2026, 2025
    21.8, 7.9 (176%↑)
#17
Batesville, MS
(
8.5 points
Down
)
  • Circle Population
    Population
    7,272
  • Circle Gun
    VC Rate 2026, 2025
    3.4, 3.0 (13%↑)
  • Circle Property
    PC Rate 2026, 2025
    58.4, 37.8 (55%↑)
#18
Lone Tree, CO
(
8.5 points
Down
)
  • Circle Population
    Population
    13,992
  • Circle Gun
    VC Rate 2026, 2025
    4.4, 3.3 (31%↑)
  • Circle Property
    PC Rate 2026, 2025
    111.6, 104.0 (7%↑)
#19
Signal Hill, CA
(
8.4 points
Down
)
  • Circle Population
    Population
    11,068
  • Circle Gun
    VC Rate 2026, 2025
    9.1, 6.7 (36%↑)
  • Circle Property
    PC Rate 2026, 2025
    61.5, 51.6 (19%↑)
#20
Waycross, GA
(
8.2 points
Down
)
  • Circle Population
    Population
    13,644
  • Circle Gun
    VC Rate 2026, 2025
    10.3, 6.4 (61%↑)
  • Circle Property
    PC Rate 2026, 2025
    50.5, 48.6 (4%↑)

A closer look at the cities with the worst safety score declines in the US

For the purposes of this report, the terms “dangerous” and “safest” refer explicitly to crime rates as calculated from FBI crime data—no other characterization of any community is implied or intended.

  • Huntsville, AL; Independence, MO; and Lawrence, KS, have the largest populations on this list. But it's not just larger cities that saw steep declines in their safety scores — smaller cities like La Junta, CO (population 6,942) are also on the list. 
  • 5 of the top 20 cities reported some of the most significant increases in property crime nationwide: Huntsville, AL (232%); Elmira, NY (185%); Lawrence, KS (176%); Independence, MO (168%); and Springdale, OH (126%).
  • Every city in the top 20 saw an increase in aggravated assault, ranging from about a 12% increase in Batesville, MS, to a nearly 296% increase in Huntsville, AL. 
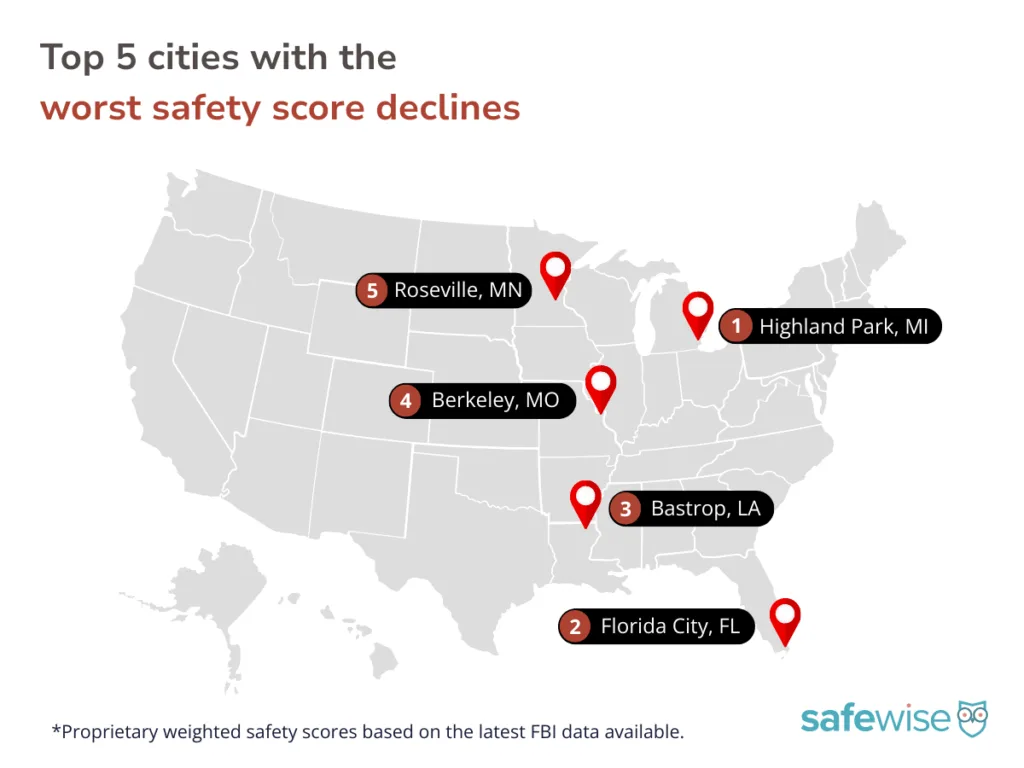
  • In terms of murder, 7 cities reported an increase, 5 cities reported a decrease, and 8 cities reported no change. Globe, AZ; Lone Tree, CO; Signal Hill, CA; and Roseville, MN, reported zero murders.
  • Murder increased by about 25% on average in the top 20 cities, making it the slowest-increasing crime.
  • Vinita Park, MO is the only city in the top 20 to see a year-over-year decrease in crime. Its property crime rate fell by 13% thanks to fewer motor vehicle thefts and burglaries. 
  • Motor vehicle thefts jumped from 1 to 23 year over year in Florida City, FL, which is a 2,200% increase.
  • Despite having about 100,000 fewer residents than Huntsville, AL, Independence, MO saw 178 more motor vehicle thefts in the 2026 reporting year.
  • On average, motor vehicle thefts increased by 218% in the top 20 cities. No other crime saw more than an 86% increase on average.
  • Blytheville, AR, was the only city in the top 20 to report a decrease in larceny-theft (a 19.4% drop).
  • In Huntsville, AL, the violent crime rate jumped from 1.3 to 4.8 incidents per 1,000 people. Although it's a significant increase, Huntsville's violent crime rate is lower than the average in Alabama (4.91). 
  • Lone Tree, CO's violent crime rate is less than the average violent crime rate in Colorado, but its property crime rate is more than double. La Junta, CO's violent crime rate also falls below average, but its property crime rate is more than three times higher. 
  • Lawrence, KS, earned the highest overall safety score of 85.5 (scores closer to 100 indicate lower crime rates). 

Get involved: Tips to help you research the safety of your community

Whether or not your city ranks high or low for per capita crime rates, there's a lot you can do to get a better grasp on how safe your neck of the woods really is. Stop wondering and start learning with these tips to find out more about what's happening in your neighborhood or city and how you can get involved.

  • Take a look outside: Paying attention to your street or neighborhood can tell you a lot. Some things to look for that can make a neighborhood safer include: street lighting, safe walking and biking paths/lanes, access to emergency services, fire hydrants, clean sidewalks, roads, and parks.
  • Check out online tools: There are safety apps and websites that offer things like real-time crime data and neighbor-shared concerns. These apps and sites also offer community resources for public safety, emergency responders, community programs and education, and other risks like natural disasters.
  • Get involved with your community: Talk to neighbors, go to city council and school board meetings, and keep an eye on local and national policies that can impact your safety. Learn about how budgets (is public safety funded adequately?) and community resources can contribute to or detract from safety trends and security. Join or start neighborhood safety programs to advocate for things like better street lighting, safer sidewalks during winter months, etc.

How we measure rapid declines

This ranking is based on the same FBI crime data used in our annual Safest Cities report. We evaluate both violent crime (aggravated assault, robbery, rape, and murder) and property crime (burglary, larceny-theft, and motor vehicle theft), calculating rates per 1,000 residents to allow for fair comparisons across cities of different sizes.

For the list of cities with rapidly declining safety scores, we analyzed year-over-year changes in those standardized rates and identified the cities that achieved the largest overall increase in their weighted safety scores.

Cities included in the analysis:

  • Met minimum population thresholds
  • Submitted complete crime data to the FBI
  • Qualified under our standardized scoring methodology

Violent and property crimes are weighted equally in our scoring model. Cities are ranked based on the magnitude of their decline — not by having the highest crime rate overall.

From rankings to real-world safety

Our Safest Cities rankings help highlight crime incidence patterns and relative risk — but they don’t determine what happens in a community or a home. How safe a community is (or isn't) is the result of a mix of individual choices, community conditions, and external factors like the economy, job market, housing availability, and local priorities.

Expand the sections below for a closer look at what you can do to help improve the safety of your community.

It's not possible to eliminate risk entirely, but you can reduce your potential risk by staying informed about local crime trends, practicing situational awareness (know who belongs in your neighborhood, work parking lot, etc.), and taking practical steps to protect yourself and your property.

Getting involved in your community can make a big difference — but you should expect certain baseline crime prevention measures from your neighborhood and city.

  • Good lighting in public spaces
  • Visible community law enforcement presence
  • Neighborhood watch-type groups/support
  • Access to a community liasion officer or department
  • Budget to support community safety programs (beyond law enforcement)

Strong local networks — whether formal or informal (or in-person or virtual) — can play an essential role in improving safety beyond what statistics alone can capture.

Our research and national crime data consistently point to the value of layered prevention. This means that the more layers you put between your home and loved ones and criminals, the better chance you have of actually deterring a criminal act.

Multiple security layers can look like a neighborhood watch plan combined with locking your doors when you leave the house, and a security camera with a siren that can scare an intruder away. A monitored security system that connects you to faster help if something happens adds an extra proactive layer.

Research-backed practices that help reduce exposure include:

  • Community prevention: Improved lighting, clear sightlines (trim hedges and bushes near doors/windows), and coordinated neighborhood efforts
  • Awareness and reporting: Stay alert, trust your instincts, know who and what belongs in your neighborhood, and report suspicious behavior
  • Home safety fundamentals: Secure all entry points (don't forget the deck or the sliding glass door), eliminate hiding spots around your home, and get into consistent security routines (locking the door, arming the security system)
  • Targeted technology use: Pair common-sense safety habits with tools that support awareness or response, like monitored security systems or cameras

Find the safest cities in each state

Click on the state below to check out the safest cities for each state.

How we determine and interpret these rankings

Our Safest Cities rankings offer a data-informed look at crime trends across cities. They’re designed to highlight relative risk — not to define overall quality of life or what it’s like to live in a community.

We use the most recent FBI-reported violent and property crime data, and adjust for population so we can compare cities of different sizes fairly. This approach helps us identify patterns and differences in reported crime rates.

We understand that crime statistics reported to one source don’t tell the whole story. A number of factors, including local agency reporting practices, community resources, prevention efforts, and lived experience all influence how safe a place is (or is perceived to be) — and not all of that shows up in the numbers.

Think of these rankings as a starting point. Our goal is to help readers understand crime trends and ask informed questions, not to judge communities or the people who call them home.

Learn how we identified the safest cities on our methodology page.

Get a deeper understanding of our independent research, data sources, calculations, and how we refine our reports each year.

Find all endnotes and sources in our full methodology.

FBI Crime Data Explorer, "Documents & Downloads." 

  • 2024 Crime in the United States Annual Reports
    • Offenses Known to Law Enforcement
  • 2024 NIBRS Estimation Tables

Bureau of Justice Statistics, "National Incident-Based Reporting System (NIBRS)." 

Gun Violence Archive, "Mass Shootings." 

Safest Cities Badges:
Safest Cities badges are available at no charge for use by law enforcement agencies and city government. City government and law enforcement representatives should contact [email protected]
to inquire about badge usage. Please put "Safest Cities badge request" in your subject line.

Badges are also available for licensing by other entities, including tourism boards, local businesses, and similar organizations. All other interested parties should contact our official partner, Wright’s Media, for information on available usages, license fees, and award seal artwork at [email protected].

Cathy Habas
Written by
With over 12 years of experience as a content writer, Cathy has a knack for untangling complex information. Her natural curiosity and ability to empathize help Cathy offer insightful, friendly advice. She believes in empowering readers who may not feel confident about a purchase, project, or topic. Cathy earned her Bachelor of Arts degree in English from Indiana University Southeast and began her professional writing career immediately after graduation. She is a certified Safe Sleep Ambassador and has contributed to sites like Safety.com, Reviews.com, Hunker, and Thumbtack. Cathy’s pride and joy is her Appaloosa “Chacos.” She also likes to crochet while watching stand-up comedy specials on Netflix.

Recent Articles

kids blowing bubbles
Verizon Gizmo Watch Review
Our child safety expert compares the Verizon Gizmo Watch 3 and Gizmo Watch 3 Adventure....
ICE Enforcement in a town.
How to Prepare for ICE Enforcement: Know Your Rights and Stay Safe
Learn how to prepare for ICE enforcement, understand your rights, protect your family, and know...
""
SafeWise 2026 Safety Guide
It's rough out there. SafeWise rounded up safety experts for the best tips on how...
Tracki GPS Tracker Review
We review the Tracki GPS Tracker—a compact, versatile device ideal for tracking children, vehicles, and...