
See crime rates for the safest cities.
Mississippi’s Safest Cities of 2026
For over 13 years, SafeWise experts have conducted independent research and testing to write unbiased, human reviews (not robots). Learn more.
Cathy has been a SafeWise contributor since 2021, helping turn crime data into clear, useful safety insights.

Here are the 10 Safest Cities in Mississippi for 2026
Mississippi residents who took our State of Safety survey were far less likely to have experienced gun violence and other violent crimes in the 12 months leading up to our survey compared to the previous year. However, most Mississippians believe crime is on the rise.
Meanwhile, violent crime and property crime rates are much lower than average in Mississippi's 10 safest cities.

Download the full list of cities in your state
Enter your email to get the full list with crime stats.
By signing up, you agree to our Terms and Conditions and Privacy Policy.
NOTE: If your city is missing from our full report, it means that it was below the population threshold or didn’t submit a complete crime report to the FBI in 2023.
Mississippi crime rates and safety concerns
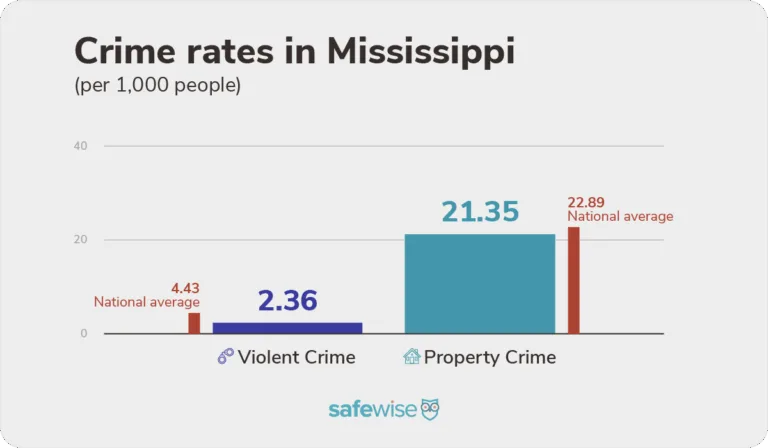
Bar chart comparing Mississippi violent and property crime rates to national averages. Mississippi is below average in both categories. Image: SafeWise
The violent crime rate in Mississippi is 2.36 incidents per 1,000 people, which is lower than the national average of 4.43. We weren't able to report a statewide violent crime rate last year due to insufficient data, but in our 2024 report, Mississippi reported the lowest violent crime rate in the nation—0.4. In this year's report, Mississippi reported the sixth-lowest violent crime rate.
Property crime in The Magnolia State also increased in recent years, rising from 18.2 incidents per 1,000 people in 2024 to 21.35 incidents in this year's report. That's lower than the national property crime rate of 22.89.
Mississippians who took our State of Safety survey report a much lower confidence level compared to the previous year. Just 37% say they feel safe in the state, down from 54% the year before. Nearly two-thirds (64%) believe crime is increasing, which is the second highest percentage in the nation behind Pennsylvania.
Property crime in Mississippi: Fear vs. reality
According to our State of Safety survey, Mississippians are among those most likely to experience property crime and package theft. They're also more likely to worry about these crimes compared to the average American.
- 29% said they had personal experience with property crime during the 12 months prior to our survey, up from 21% the year before (US 21%).
- Only residents of Alaska reported more property crime experiences than Mississippians (30% AK).
- Daily concern about property crime decreased from 59% to 51% year over year (US 46%).
- 38% of Mississippi residents said they had personally experienced package theft in the 12 months prior to our survey, up from 34% the year before (US 31%).
- Daily concern about package theft rose from 42% to 46%(US 44%).
- Mississippians prefer to protect their property with firearms (52%), security cameras (52%), and guard dogs (42%).
- 26% told us they increased their security measures in the 12 months prior to the survey (US 32%).
"My biggest concern was break ins. There were a lot of break ins in the neighborhood."
—Mississippi resident*
—Mississippi resident*
What security measures are used the most in Mississippi?
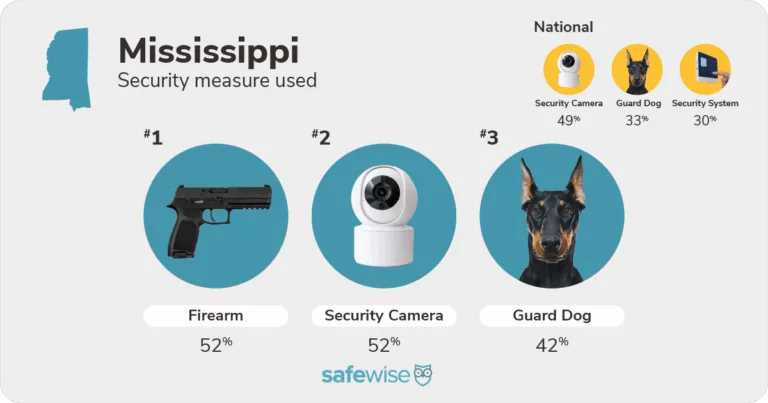
Top security measures used in Mississippi (firearms, security cameras, and guard dogs) compared to national trends. Image: SafeWise
What crimes are Mississippi residents concerned about most?
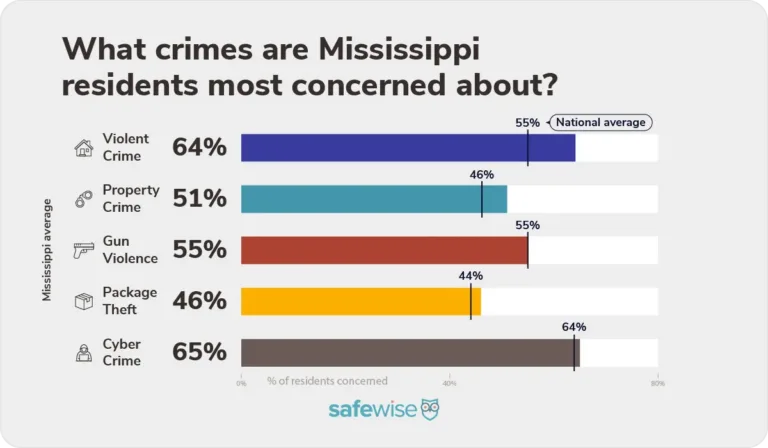
Bar chart showing the percentage of Mississippi residents concerned about violent crime, property crime, gun violence, package theft, and cyber crime. Image: SafeWise
Violent crime in Mississippi: Fear vs. reality
The percentage of Mississippians who told us they experienced violent crime in the 12 months prior to our survey fell substantially year over year and, for the first time in years, is lower than the national average. Concern about violent crime rose during the same time period.
- 8% of Mississippians experienced violent crime in the 12 months prior to our survey, down considerably from 17% the previous year (US 12%).
- The percentage of Mississippi residents who worry about violent crime on a daily basis increased from 62% to 64% year over year (US 55%).
- 43% of survey participants report using some form of personal protection.
- Mississippi residents prefer to protect themselves with firearms (67%), and pocket knives (49%), and pepper spray (35%).
"My biggest concerns are the lack of security in the neighborhood and stopping violence that occurs every other week."
—Mississippi resident*
—Mississippi resident*
Attitudes about gun violence in Mississippi
- 7% of Mississippians experienced gun violence in the 12 months prior to our survey, a substantial decrease from 15% the year before (US 9%).
- The percentage of Mississippi residents who worry about gun violence on a daily basis decreased slightly from 58% to 55% year over year (US 55%).
- Mississippians worry about violent crime in general more than they worry about gun violence in particular.
- Guns are the most popular form of personal protection in Mississippi, with 67% saying they carry a concealed firearm (US 45%).
- Mississippi had 14 mass shootings in 2025, down from 24 in 2024.
"There seems to be an increase of attacks happening in common places were people gather. Like malls and parades that cause a level of anxiety about being out in public spaces."
—Mississippi resident*
—Mississippi resident*
*Quotes collected from our State of Safety survey.
A closer look at the safest cities in Mississippi
For the purposes of this report, the terms “dangerous” and “safest” refer explicitly to crime rates as calculated from FBI crime data—no other characterization of any community is implied or intended.
- 32 cities met the criteria for ranking this year.
- Madison is Mississippi's safest city of 2026.
- Brandon is #2 for the second year in a row, and Hernando is #3 for the third year in a row.
- Property crime and violent crime rates decreased year over year in Byram and New Albany.
- Most of Mississippi's safest cities are suburbs of larger metros like Memphis and Jackson.
- Richland's violent crime rate decreased by more than 50% year over year.
- Madison, Petal, and Richland reported zero robberies.
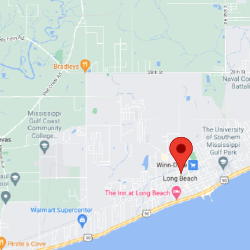
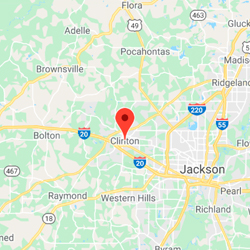
- Richland, Long Beach, New Albany, and Clinton reported zero murders.
- Madison, New Albany, and Horn Lake reported zero rapes.
The 10 safest cities in Mississippi
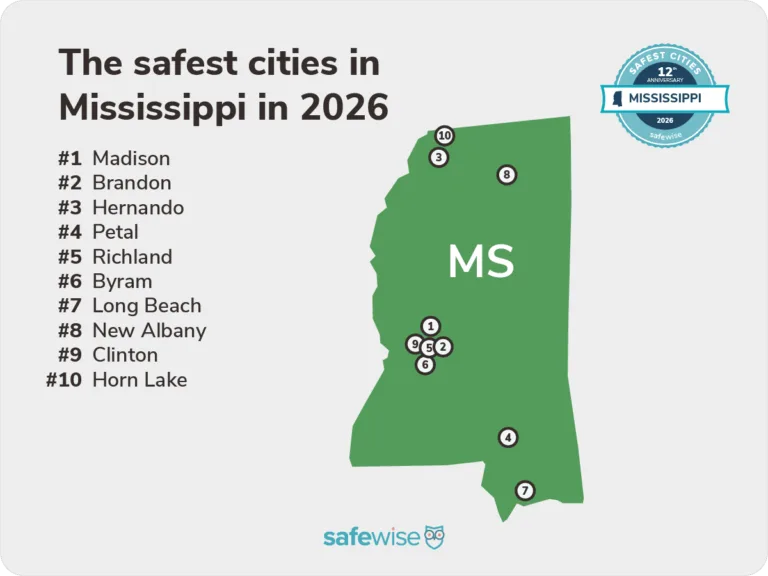
Map of the safest cities in Mississippi for 2026, listing top 10 ranked cities based on SafeWise crime data. Image: SafeWise

#1
Madison
(
 )
)
+3
-
 Population28,064
 -
 VC Rate 2026, 2025, 20240.5, 0.4, 0.5
 -
 PC Rate 2026, 2025, 20243.9, 6.3, 5.9
 -
 VC=Violent crime, PC=Property crime

#2
Brandon
(
-0-
)-
Population25,905
-
VC Rate 2026, 2025, 20240.9, 0.8, 1.1
-
PC Rate 2026, 2025, 20243.8, 3.6, 4.9
-
VC=Violent crime, PC=Property crime
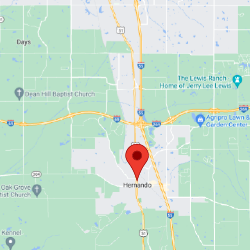
#3
Hernando
(
-0-
)-
Population18,579
-
VC Rate 2026, 2025, 20240.9, 0.5, 0.9
-
PC Rate 2026, 2025, 20244.8, 5.4, 5.4
-
VC=Violent crime, PC=Property crime
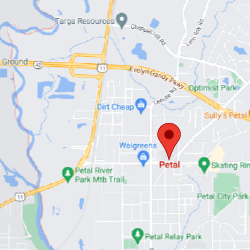
#4
Petal
(
 )
)
-3
-
Population11,505
-
VC Rate 2026, 2025, 20241.3, 0.5, 0.7
-
PC Rate 2026, 2025, 20243.9, 3.8, 4.3
-
VC=Violent crime, PC=Property crime
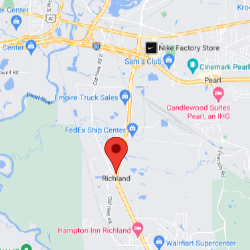
#5
Richland
(
)
+2
-
Population7,486
-
VC Rate 2026, 2025, 20240.5, 1.2, 1.4
-
PC Rate 2026, 2025, 20249.9, 9.0, 14.1
-
VC=Violent crime, PC=Property crime
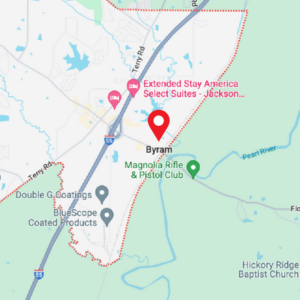
#6
Byram
(
)
+4
-
Population12,526
-
VC Rate 2026, 2025, 20240.8, 1.0, 2.4
-
PC Rate 2026, 2025, 20248.8, 14.2, 11.1
-
VC=Violent crime, PC=Property crime
#7
Long Beach
(
)
-2
-
Population17,053
-
VC Rate 2026, 2025, 20240.8, 0.1, 0.5
-
PC Rate 2026, 2025, 202410.0, 10.6, 15.6
-
VC=Violent crime, PC=Property crime

#8
New Albany
(
)
+6
-
Population7,733
-
VC Rate 2026, 2025, 20240.8, 1.3, 0.3
-
PC Rate 2026, 2025, 202411.4, 19.8, 23.3
-
VC=Violent crime, PC=Property crime
#9
Clinton
(
)
-1
-
Population26,285
-
VC Rate 2026, 2025, 20240.7, 1.1, 0.9
-
PC Rate 2026, 2025, 202412.1, 12.1, 11.0
-
VC=Violent crime, PC=Property crime

#10
Horn Lake
(
)
+2
-
Population26,378
-
VC Rate 2026, 2025, 20241.1, 0.8, 1.5
-
PC Rate 2026, 2025, 202414.1, 20.0, 21.2
-
VC=Violent crime, PC=Property crime
From rankings to real-world safety
Our Safest Cities rankings help highlight crime incidence patterns and relative risk — but they don’t determine what happens in a community or a home. How safe a community is (or isn't) is the result of a mix of individual choices, community conditions, and external factors like the economy, job market, housing availability, and local priorities.
Expand the sections below for a closer look at what you can do to help improve the safety of your community.
It's not possible to eliminate risk entirely, but you can reduce your potential risk by staying informed about local crime trends, practicing situational awareness (know who belongs in your neighborhood, work parking lot, etc.), and taking practical steps to protect yourself and your property.
Getting involved in your community can make a big difference — but you should expect certain baseline crime prevention measures from your neighborhood and city.
- Good lighting in public spaces
- Visible community law enforcement presence
- Neighborhood watch-type groups/support
- Access to a community liasion officer or department
- Budget to support community safety programs (beyond law enforcement)
Strong local networks — whether formal or informal (or in-person or virtual) — can play an essential role in improving safety beyond what statistics alone can capture.
Our research and national crime data consistently point to the value of layered prevention. This means that the more layers you put between your home and loved ones and criminals, the better chance you have of actually deterring a criminal act.
Multiple security layers can look like a neighborhood watch plan combined with locking your doors when you leave the house, and a security camera with a siren that can scare an intruder away. A monitored security system that connects you to faster help if something happens adds an extra proactive layer.
Research-backed practices that help reduce exposure include:
- Community prevention: Improved lighting, clear sightlines (trim hedges and bushes near doors/windows), and coordinated neighborhood efforts
- Awareness and reporting: Stay alert, trust your instincts, know who and what belongs in your neighborhood, and report suspicious behavior
- Home safety fundamentals: Secure all entry points (don't forget the deck or the sliding glass door), eliminate hiding spots around your home, and get into consistent security routines (locking the door, arming the security system)
- Targeted technology use: Pair common-sense safety habits with tools that support awareness or response, like monitored security systems or cameras
- Explore our safety research
- See crime trends by state
- Learn more about home security essentials
How we determine and interpret these rankings
Our Safest Cities rankings offer a data-informed look at crime trends across cities. They’re designed to highlight relative risk — not to define overall quality of life or what it’s like to live in a community.
We use the most recent FBI-reported violent and property crime data, and adjust for population so we can compare cities of different sizes fairly. This approach helps us identify patterns and differences in reported crime rates.
Our analysis includes only crime data from agencies that submitted complete reports to the FBI through the National Incident-Based Reporting System (NIBRS). We do not estimate crime totals for agencies with incomplete reporting, so our findings and crime rate trends may differ from reports that include estimated national crime data.
We understand that crime statistics reported to one source don’t tell the whole story. A number of factors, including local agency reporting practices, community resources, prevention efforts, and lived experience all influence how safe a place is (or is perceived to be) — and not all of that shows up in the numbers.
Think of these rankings as a starting point. Our goal is to help readers understand crime trends and ask informed questions, not to judge communities or the people who call them home.
Learn how we identified the safest cities on our methodology page.
Get a deeper understanding of our independent research, data sources, calculations, and how we refine our reports each year.
Related articles on SafeWise
Endnotes and sources
Find all endnotes and sources in our full methodology.
FBI Crime Data Explorer, "Documents & Downloads."
- 2024 Crime in the United States Annual Reports
- Offenses Known to Law Enforcement
- 2024 NIBRS Estimation Tables
Bureau of Justice Statistics, "National Incident-Based Reporting System (NIBRS)."
Gun Violence Archive, "Mass Shootings."
Safest Cities Badges:
Safest Cities badges are available at no charge for use by law enforcement agencies and city government. City government and law enforcement representatives should contact [email protected]
to inquire about badge usage.
To request a badge:
- Please put "Safest Cities badge request" in your subject line
- Include the name of your city and state
- Share the city government or law enforcement agency you represent
Badges are also available for licensing by other entities, including tourism boards, local businesses, and similar organizations. All other interested parties should contact our official partner, Wright’s Media, for information on available usages, license fees, and award seal artwork at [email protected].
Recent Articles

Jury Finds Meta and YouTube Negligent in Landmark Social Media Addiction Case
Meta and YouTube were found negligent in a landmark addiction case. Here’s why it matters...
How Safe Are the Fastest-Growing U.S. Cities?
Does a surge in population lead to a surge in crime? Find out in our...

Package Theft and Cybercrime Are Now the Most Common Crimes in America
State of Safety data shows Americans are more likely to experience package theft and cybercrime...
Alternatives to ADT Home Security Systems (2026)
Not sure ADT is right for you? Discover the best home security systems with flexible...