In some U.S. cities, you're at least 10 times more likely to have your car stolen compared to the national average. Is your vehicle safe where you live, work, and play? Find out in our analysis of the latest FBI data, and learn how to beef up your car security measures to protect one of your biggest investments.
The 20 U.S. Cities Where You’re Most Likely to Have Your Car Stolen
For over 13 years, SafeWise experts have conducted independent research and testing to write unbiased, human reviews (not robots). Learn more.
Cathy has been a SafeWise contributor since 2021, helping turn crime data into clear, useful safety insights.

Here are the top 10 cities with the highest motor vehicle theft rates
See if your city made the full list.
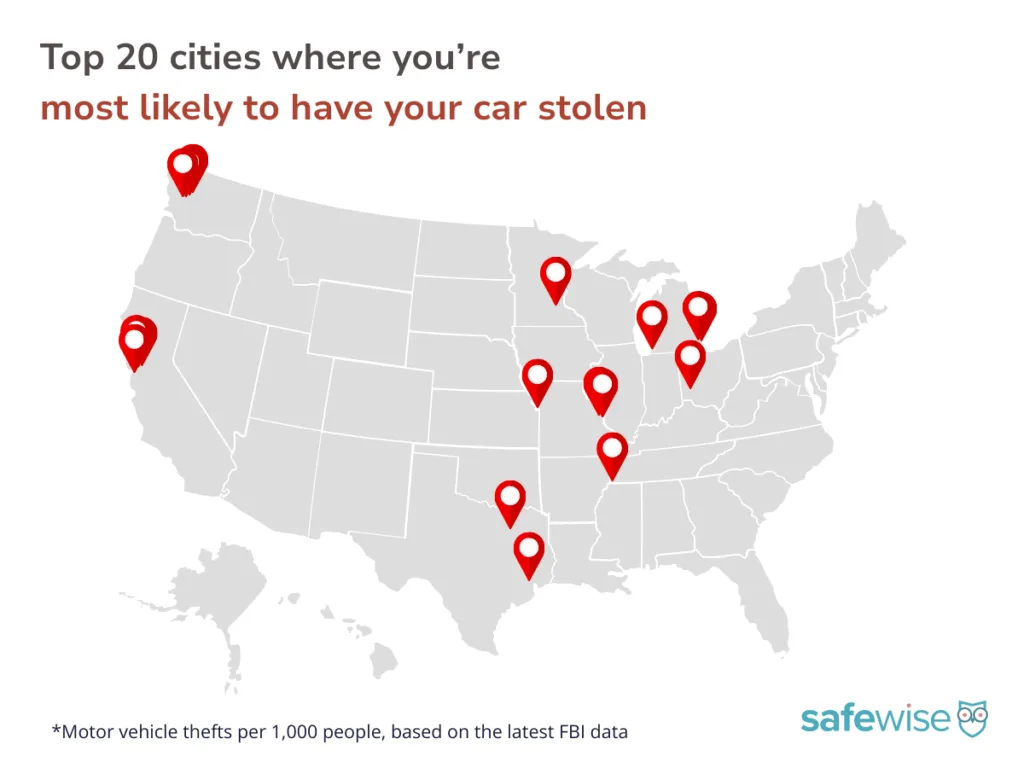
A map of the 20 U.S. cities with the highest rates of motor vehicle theft per 1,000 people, according to the latest FBI data. Image: SafeWise
National motor vehicle theft trends: Downward momentum
Here's the good news: car theft is becoming less common throughout the U.S. In the 2025 reporting year, the national average motor vehicle theft rate was 2.1 incidents per 1,000 people. In the 2026 reporting year, it fell to 1.7 incidents per 1,000 people. That's a difference of 135,118 cars in over 3,600 cities.*
Still, more than 1,100 cities report a higher-than-average motor vehicle theft rate, and nearly 58 million people live in a city where the risk of motor vehicle theft is at least double the national average.
On the opposite end of the spectrum, 72 cities that met our population criteria reported zero motor vehicle thefts. That list includes some cities with relatively large populations, like Columbus, IN (51,867), Mason, OH (35,923), and Cranberry Township, PA (34,970).
When we compare city rankings from the 2025 and 2026 reporting years — with #1 indicating the city with the highest motor vehicle theft rate nationwide — certain cities stand out for falling dramatically down the list. Livingston, MT shows the most improvement, dropping from #863 to #3,075 in just one year thanks to an 87.5% decrease in car theft. Dexter, MO; Fort Scott, KS; Russellville, KY; and Swansea, IL round out the top 5 cities with the most improved rankings.
*We only looked at cities with a population greater than or equal to the median population of all U.S. cities. This helps us avoid extreme outliers and skewed data. Learn more about our city ranking methodology.
Regional trends: Where motor vehicle thefts are concentrated
The latest FBI data reveals two distinct hotspots for motor vehicle theft:
- The Seattle-Tacoma-Bellevue, WA metropolitan area, where you're up to 17 times more likely to have your car stolen compared to the national average.
- The San Francisco-Oakland-Fremont, CA metropolitan area, where you're up to 14.7 times more likely to have your car stolen.
Motor vehicle thefts also tend to occur in Midwestern cities, especially those in Missouri and Michigan.
The South is represented on the top 20 list as well thanks to high motor vehicle rates in Memphis, TN and two Texas cities: Humble (a Houston suburb) and Addison (a Dallas suburb).
We have to look beyond the top 20 to find hotspots in other regions:
- The Denver, CO area leads the way in the Mountain region (up to 7.3 times higher than national average).
- Irvington, NJ; Greenbelt, MD; and Baltimore, MD tie for the highest motor vehicle theft rate on the east coast (6.2 times higher than the national average).
- Albuquerque, NM is the Southwest hotspot (6.1 times higher than the national average).
- Bessemer, AL reports the highest motor vehicle theft rate in the Deep South (5.5 times higher than the national average).
- Hartford, CT and New Haven, CT represent New England hotspots (up to 4.9 times higher than the national average).
Expert insights into vehicle theft
We asked Jeff Ketelaars, a security expert with more than 35 years of experience, why cities like Seattle and San Francisco have such high rates of motor vehicle theft. Here's what he had to say:
"In these cities, car theft is more common partly because of how dense the areas are. There are a lot of vehicles parked on streets, in public garages, and in large apartment complexes where owners are not always nearby. From what many security teams see, busy cities also make it easier for thieves to move around without drawing attention. Another reason is easy highway and port access, which can help move stolen vehicles or parts quickly."
According to Ben Stickle — a criminologist, theft expert, and member of SafeWise's advisory group — cars tend to be stolen for three main reasons:
- Short-term usage, like joyriding or committing another crime with the vehicle
- To strip and resell parts
- To resell the entire car with a fraudulent title
Jenna Bailey, a trial attorney and former prosecutor, adds that "a significant portion of [vehicle] theft today is associated with organized activity." She says cars are often sent overseas. This may explain why car theft is especially common in the port cities of Seattle and San Francisco.
"Certain car models do tend to get stolen more often," says Ketelaars. "Older cars without modern anti-theft systems are often targeted because they're easier to start without a key. But several Hyundai and Kia vehicles manufactured roughly between 2011 and 2021 became major theft targets because they lack engine immobilizers, technology that prevents the car from starting without the correct electronic key signal. Once this weakness became known online, theft rates for those models surged online."
According to data from the National Insurance Crime Bureau, the top two vehicles stolen are indeed Hyundai models, specifically the Elantra and Sonata. Honda models (Accord, Civic, and CR-V), Kia models (Optima and Soul), popular pickup trucks (Chevy Silverado 1500, Ford F150), and the Toyota Camry round out the list of the top 10 most stolen vehicles in the U.S.
Ketelaars says the Honda Rav4 is also vulnerable because "they have a high resale value in countries where they end up." He adds that some luxury SUVs, like Cadillacs and Yukons, are popular targets for stripping and reselling parts.
The top 20 cities with the highest motor vehicle theft rates of 2026
MVT= Motor vehicle theft, YOY=Year over year; Crime rates per 1,000 people

#1
Tukwila, WA
(
-0-
)-
 Population20,933
 -
 MVT Rate 2026, 202528.9, 42.8
 -
 Change YOY32.5%↓

#2
Emeryville, CA
(
-0-
)-
Population12,671
-
MVT Rate 2026, 202525.0, 35.8
-
Change YOY30%↓

#3
Berkeley, MO
(
 )
)
+3
-
Population7,970
-
MVT Rate 2026, 202522.1, 25.5
-
Change YOY13.3%↓

#4
Humble, TX
(
)
+24
-
Population16,076
-
MVT Rate 2026, 202517.7, 16.1
-
Change YOY10%↑

#5
Kansas City, MO
(
)
+17
-
Population511,535
-
MVT Rate 2026, 202517.2, 17.6
-
Change YOY2.2%↓

#6
Memphis, TN
(
 )
)
-1
-
Population613,207
-
MVT Rate 2026, 202516.0, 25.8
-
Change YOY37.8%↓

#7
Minneapolis, MN
(
)
+11
-
Population423,282
-
MVT Rate 2026, 202515.6, 18.5
-
Change YOY15.5%↓

#8
Addison, TX
(
-0-
)-
Population17,367
-
MVT Rate 2026, 202515.3, 22.5
-
Change YOY31.8%↓

#9
Fife, Washington
(
)
-6
-
Population10,612
-
MVT Rate 2026, 202515.1, 34.1
-
Change YOY55.8%↓

#10
St. Louis, MO
(
)
-1
-
Population277,294
-
MVT Rate 2026, 202514.9, 22.4
-
Change YOY33.4%↓

#11
Harper Woods, MI
(
)
+2
-
Population14,717
-
MVT Rate 2026, 202514.7, 19.2
-
Change YOY23%↓

#12
Benton Harbor, MI
(
)
+61
-
Population8,804
-
MVT Rate 2026, 202514.1, 10.9
-
Change YOY29.2%↑

#13
Hayward, CA
(
)
+16
-
Population153,419
-
MVT Rate 2026, 202513.7, 15.4
-
Change YOY10.9%↓

#14
Antioch, CA
(
)
+66
-
Population117,675
-
MVT Rate 2026, 202513.7, 10.4
-
Change YOY31.1%↑

#15
SeaTac, WA
(
)
-5
-
Population31,950
-
MVT Rate 2026, 202513.6, 22.2
-
Change YOY38.7%↓

#16
Tacoma, WA
(
)
-12
-
Population223,980
-
MVT Rate 2026, 202513.5, 27.6
-
Change YOY51.2%↓

#17
Dayton, OH
(
)
+8
-
Population134,857
-
MVT Rate 2026, 202513.2, 17.1
-
Change YOY22.7%↓

#18
Alameda, CA
(
)
+6
-
Population74,458
-
MVT Rate 2026, 202512.8, 17.2
-
Change YOY25.4%↓

#19
Auburn, WA
(
)
-4
-
Population82,838
-
MVT Rate 2026, 202512.6, 18.7
-
Change YOY32.7%↓

#20
Detroit, MI
(
)
+18
-
Population651,171
-
MVT Rate 2026, 202512.6, 14.2
-
Change YOY11.7%↓
A closer look at the 20 US cities with the highest rates of motor vehicle theft
For the purposes of this report, the terms “dangerous” and “safest” refer explicitly to crime rates as calculated from FBI crime data—no other characterization of any community is implied or intended.
- 3,676 cities qualified for ranking.
- 3.5 million people live in the top 20 cities.
- 50,640 vehicles were reported stolen in the top 20 cities in the 2026 reporting year. That's 16,000 fewer than in the 2025 reporting year, which is a decrease of 24%.
- Tukwila, WA has the highest motor vehicle theft rate in the country at 28.9 incidents per 1,000 people. That's more than double the rate of 9 cities in the top 20.
- Only 3 of the top 20 cities saw a year-over-year increase in motor vehicle theft: Humble, TX; Benton Harbor, MI; and Antioch, CA. All other cities reported fewer motor vehicle thefts.
- Of the top 20 cities, Fife, WA reported the greatest improvement in its motor vehicle theft rate (down by nearly 56% year over year). Fife also appears on our list of cities with the most improved safety scores.
- Every city in the top 20 is either a major metro or a suburb of a major metro, with the exception of Benton Harbor, MI — a city of about 8,800 people located on the eastern shores of Lake Michigan.
Preventing car theft: Products and tips
- Don't make it easy: Always lock your car doors and don't keep the keys in the ignition or visor. Remove the valet key from the glovebox. Keep your windows rolled up when parked, and park in well-lit areas.
- Install a remote car starter. This lets you run the car to heat it up without having to leave the keys in the ignition with the car doors unlocked.
- Upgrade your car alarm. Consider a model that sends text notifications so you don't have to be within earshot to know someone's tampering with your car.
- Hide a kill switch. No one will be able to start the car without finding the kill switch first.
- Use a steering wheel lock, brake lock, or tire lock. These steel devices require heavy-duty equipment to bust through, so they should deter people who don't want to make a scene.
- Etch the VIN number onto the windows. Etch it onto other areas too for good measure. Parts are difficult to sell when they can be easily identified and traced by law enforcement.
- Increase security around your driveway or garage. According to the FBI, one-third of all motor vehicle thefts take place at a residence. Use outdoor security cameras, motion sensor lights, and driveway alarms as deterrents.
From rankings to real-world safety
Our Safest Cities rankings help highlight crime incidence patterns and relative risk — but they don’t determine what happens in a community or a home. How safe a community is (or isn't) is the result of a mix of individual choices, community conditions, and external factors like the economy, job market, housing availability, and local priorities.
Expand the sections below for a closer look at what you can do to help improve the safety of your community.
It's not possible to eliminate risk entirely, but you can reduce your potential risk by staying informed about local crime trends, practicing situational awareness (know who belongs in your neighborhood, work parking lot, etc.), and taking practical steps to protect yourself and your property.
Getting involved in your community can make a big difference — but you should expect certain baseline crime prevention measures from your neighborhood and city.
- Good lighting in public spaces
- Visible community law enforcement presence
- Neighborhood watch-type groups/support
- Access to a community liasion officer or department
- Budget to support community safety programs (beyond law enforcement)
Strong local networks — whether formal or informal (or in-person or virtual) — can play an essential role in improving safety beyond what statistics alone can capture.
Our research and national crime data consistently point to the value of layered prevention. This means that the more layers you put between your home and loved ones and criminals, the better chance you have of actually deterring a criminal act.
Multiple security layers can look like a neighborhood watch plan combined with locking your doors when you leave the house, and a security camera with a siren that can scare an intruder away. A monitored security system that connects you to faster help if something happens adds an extra proactive layer.
Research-backed practices that help reduce exposure include:
- Community prevention: Improved lighting, clear sightlines (trim hedges and bushes near doors/windows), and coordinated neighborhood efforts
- Awareness and reporting: Stay alert, trust your instincts, know who and what belongs in your neighborhood, and report suspicious behavior
- Home safety fundamentals: Secure all entry points (don't forget the deck or the sliding glass door), eliminate hiding spots around your home, and get into consistent security routines (locking the door, arming the security system)
- Targeted technology use: Pair common-sense safety habits with tools that support awareness or response, like monitored security systems or cameras
- Explore our safety research
- See crime trends by state
- Learn more about home security essentials
How we determine and interpret these rankings
Our Safest Cities rankings offer a data-informed look at crime trends across cities. They’re designed to highlight relative risk — not to define overall quality of life or what it’s like to live in a community.
We use the most recent FBI-reported violent and property crime data, and adjust for population so we can compare cities of different sizes fairly. This approach helps us identify patterns and differences in reported crime rates.
Our analysis includes only crime data from agencies that submitted complete reports to the FBI through the National Incident-Based Reporting System (NIBRS). We do not estimate crime totals for agencies with incomplete reporting, so our findings and crime rate trends may differ from reports that include estimated national crime data.
We understand that crime statistics reported to one source don’t tell the whole story. A number of factors, including local agency reporting practices, community resources, prevention efforts, and lived experience all influence how safe a place is (or is perceived to be) — and not all of that shows up in the numbers.
Think of these rankings as a starting point. Our goal is to help readers understand crime trends and ask informed questions, not to judge communities or the people who call them home.
Learn how we identified the safest cities on our methodology page.
Get a deeper understanding of our independent research, data sources, calculations, and how we refine our reports each year.
Related articles on SafeWise
Endnotes and sources
Find all endnotes and sources in our full methodology.
FBI Crime Data Explorer, "Documents & Downloads."
- 2024 Crime in the United States Annual Reports
- Offenses Known to Law Enforcement
- 2024 NIBRS Estimation Tables
Bureau of Justice Statistics, "National Incident-Based Reporting System (NIBRS)."
Gun Violence Archive, "Mass Shootings."
Safest Cities Badges:
Safest Cities badges are available at no charge for use by law enforcement agencies and city government. City government and law enforcement representatives should contact [email protected]
to inquire about badge usage.
To request a badge:
- Please put "Safest Cities badge request" in your subject line
- Include the name of your city and state
- Share the city government or law enforcement agency you represent
Badges are also available for licensing by other entities, including tourism boards, local businesses, and similar organizations. All other interested parties should contact our official partner, Wright’s Media, for information on available usages, license fees, and award seal artwork at [email protected].
Recent Articles

Jury Finds Meta and YouTube Negligent in Landmark Social Media Addiction Case
Meta and YouTube were found negligent in a landmark addiction case. Here’s why it matters...
How Safe Are the Fastest-Growing U.S. Cities?
Does a surge in population lead to a surge in crime? Find out in our...

Package Theft and Cybercrime Are Now the Most Common Crimes in America
State of Safety data shows Americans are more likely to experience package theft and cybercrime...
Alternatives to ADT Home Security Systems (2026)
Not sure ADT is right for you? Discover the best home security systems with flexible...