

See crime rates for the safest cities.
Colorado’s Safest Cities of 2025
For over 11 years, SafeWise experts have conducted independent research and testing to write unbiased, human reviews (not robots). Learn more.

Here are the 10 Safest Cities in Colorado for 2025
Results from our latest State of Safety survey suggest Colorado is experiencing a dip in violent crime but a rise in property crime. More Coloradans feel safe in their state and believe crime is decreasing compared to the previous year's survey, but they still worry about crime more than the average American.
In Colorado's 10 safest cities, fewer than 0.6 violent crimes per 1,000 people were reported on average, and six cities reported zero murders and rapes.
In this report

Download the full list of cities in your state
Enter your email to get the full list with crime stats.
By signing up, you agree to our Terms and Conditions and Privacy Policy.
NOTE: If your city is missing from our full report, it means that it was below the population threshold or didn’t submit a complete crime report to the FBI in 2023.
Do people feel safe in Colorado? Survey insights for 2025

Bar chart comparing how safe Colorado residents feel, with 46% feeling safe versus the 48% national average. Image: SafeWise
We didn't have enough data to calculate statewide crime rates this year, but our State of Safety survey reveals some interesting trends.
After dropping to 40% in the 2024 reporting year, the percentage of Coloradans who feel safe in their state is back up to 46%—the same percentage from our 2023 report. A steady drop in violent crime experiences may explain this increased sense of security. However, Coloradans still feel a little less safe than the average American (US 48%).
This year, more Coloradans believe crime is decreasing compared to the previous survey, but the majority (62%) say crime is on the rise.
"My biggest concern is that crime seems to be making its way closer to where we live and we live in the country. I feel that I have to make sure everything is locked when we used to be able to leave at least windows open."
—Colorado resident*
—Colorado resident*
Property crime in Colorado: Fear vs. reality
Colorado survey respondents once again reported an increase in property crime experiences year over year, rising 5 percentage points compared to the previous survey. Package theft experiences in The Centennial State also rose by 5 percentage points.
- 37% of Coloradans said they experienced property crime in the 8 months prior to our survey, which is higher than the national average of 27%.
- Coloradans reported the fourth-highest levels of property crime experience behind New Mexico, Nevada, and Oklahoma.
- 47% of Coloradans experienced package theft in the 8 months prior to the survey, which is the second-highest percentage in the nation and well above the national average of 37%.
- Colorado residents report some of the highest levels of concern about property crime (65%) and package theft (62%) in the nation, which aligns with their reported experiences.
- 35% of Coloradans told us they increased security measures in the 8 months prior to the survey.
- Of the Coloradans who use some form of property protection, 46% use security cameras and 42% use guard dogs.
- For the second year in a row, firearms and security systems tie for third place at 34% each, up from 25% the previous year.
"Theft is a huge concern. People steal from your porch, your fenced-in backyard, anything that isn't attached to your house or locked up. It's awful."
—Colorado resident*
—Colorado resident*
Cyber crime in Colorado
Our 11th annual State of Safety survey asked questions about cyber security for the first time. Coloradans reported fewer cyber crime experiences than the average American (CO 29%, US 33%) but were more likely to use certain protections.
- 69% of Coloradans worry about cyber crimes, which matches the national average and makes it the most concerning crime issue in the state.
- 16% of Coloradans say they use an identity theft protection service, which is the third-highest percentage in the nation behind Alaska and West Virginia.
- Coloradans report the third-highest usage of password managers (23%).
- Coloradans are less likely to use anti-virus and anti-malware compared to the average American.
"My biggest concern is how to save my privacy while using the internet, and having my cards being used or getting my personal information while using a shopping app or website."
—Colorado resident*
—Colorado resident*
What security measures do Coloradans use most?

Top security measures used in Colorado: guard dogs, security systems, and firearms, compared to national trends. Image: SafeWise
What crimes are Colorado residents concerned about most?

Bar chart of top crime concerns in Colorado, showing violent crime, property crime, gun violence, and package theft rates. Image: SafeWise
Violent crime in Colorado: Fear vs. reality
The percentage of Coloradans who experienced a violent crime in the 8 months prior to the survey reached a new low of 13%, down from 16% in 2023 and 19% in 2022. However, concern about violent crime is on the rise.
- 65% of Coloradans worry about violent crime on a daily basis, up from 54% the previous year (US 59%).
- Residents of 11 other states worry about violent crime more than Coloradans.
- Coloradans experience violent crime at about the same rate as the national average (CO 13%, US 14%), but more than double the rate in South Dakota (6%) and half the rate of Kentucky (28%) and Louisiana (26%).
- 16% of Coloradans surveyed say crime is decreasing in their state (US 15%).
- 40% of Coloradans use some form of personal protection (US 35%), up from 35% the previous year.
- Coloradans prefer to protect themselves with pocket knives (21%), pepper spray (20%), and firearms (18%).
"For myself personally, the biggest safety concern I currently face is transphobia."
—Colorado resident*
—Colorado resident*
Attitudes about gun violence in Colorado
- 55% of Coloradans are worried about gun violence (57% US).
- 9% of Coloradans told us they had an experience with gun violence in the 8 months prior to the survey (11% US)—a 1 point drop year over year.
- 6 mass shooting events occurred in Colorado in 2024; 10 fewer than in 2023.
- Firearms are the third most used form of personal protection in Colorado, used by 18% of those who use any kind of personal protection (US 15%).
"I worry about my safety when I attend a large event like sports or concerts. These large crowds seem to be targets."
—Colorado resident*
—Colorado resident*
*Quotes collected from our latest State of Safety survey.
A closer look at the safest cities in Colorado
For the purposes of this report, the terms “dangerous” and “safest” refer explicitly to crime rates as calculated from FBI crime data—no other characterization of any community is implied or intended.
- 56 cities in Colorado met the criteria for ranking, including 2 cities that weren’t in the running last year (Frederick and Eagle).
- This year’s safest city in Colorado—Gypsum—was in fifth place last year.
- 4 cities reported zero murders, zero rapes, and zero robberies: Gypsum, Milliken, Frederick, and Woodland Park.
- For the second year in a row, Milliken reported only 1 violent crime.
- 3 cities saw declines in both property and violent crime: Gypsum, Fruita, and Woodland Park.
- Violent crime dropped year over year in Severance and Castle Rock, and Erie's property crime rate decreased.
- All 10 of the safest cities reported fewer than 2 violent crimes per 1,000 people.
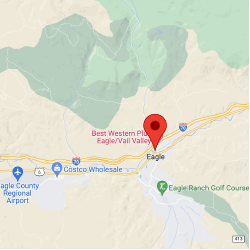
The 10 safest cities in Colorado

Map of the safest cities in Colorado for 2025, listing top 10 ranked cities based on SafeWise crime data. Image: SafeWise
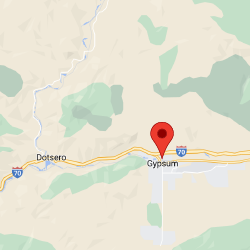
#1
Gypsum
(
 )
)
+4
-
 Population9,422
 -
 VC Rate 2025, 2024, 20230.2, 1.0, 1.2
 -
 PC Rate 2025, 2024, 20232.7, 6.2, 3.5
 -
 VC=Violent crime, PC=Property crime
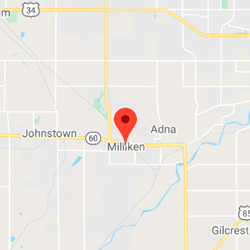
#2
Milliken
(
 )
)
-1
-
Population9,405
-
VC Rate 2025, 2024, 20230.1, 0.1, 0.0
-
PC Rate 2025, 2024, 20234.3, 4.1, 3.0
-
VC=Violent crime, PC=Property crime

#3
Windsor
(
)
-1
-
Population41,454
-
VC Rate 2025, 2024, 20230.4, 0.3, 0.6
-
PC Rate 2025, 2024, 20236.5, 5.8, 5.1
-
VC=Violent crime, PC=Property crime

#4
Severance
(
)
-1
-
Population12,197
-
VC Rate 2025, 2024, 20231.0, 0.9, 0.0
-
PC Rate 2025, 2024, 20232.7, 1.6, 2.8
-
VC=Violent crime, PC=Property crime

#5
Frederick
(
NEW
)-
Population18,522
-
VC Rate 2025, 2024, 20230.7, N/A, N/A
-
PC Rate 2025, 2024, 20237.0, N/A, N/A
-
12.0, N/A, N/AVC=Violent crime, PC=Property crime
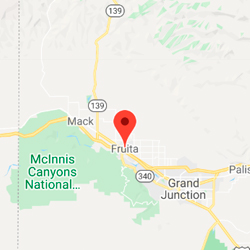
#6
Fruita
(
)
+2
-
Population13,936
-
VC Rate 2025, 2024, 20230.4, 1.2, 1.9
-
PC Rate 2025, 2024, 202310.0, 10.6, 10.2
-
VC=Violent crime, PC=Property crime

#7
Erie
(
)
-3
-
Population34,543
-
VC Rate 2025, 2024, 20230.4, 0.2, 0.5
-
PC Rate 2025, 2024, 202310.0, 10.3, 9.7
-
VC=Violent crime, PC=Property crime

#8
Castle Rock
(
)
-2
-
Population83,546
-
VC Rate 2025, 2024, 20230.2, 0.2, 0.5
-
PC Rate 2025, 2024, 202312.2, 11.8, 16.2
-
VC=Violent crime, PC=Property crime
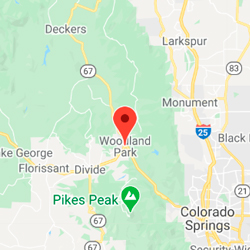
#9
Woodland Park
(
-0-
)-
Population7,971
-
VC Rate 2025, 2024, 20231.0, 1.5, 1.8
-
PC Rate 2025, 2024, 20239.2, 15.6, 14.7
-
VC=Violent crime, PC=Property crime
#10
Eagle
(
NEW
)-
Population7,410
-
VC Rate 2025, 2024, 20231.4, N/A, N/A
-
PC Rate 2025, 2024, 20238.4, N/A, N/A
-
VC=Violent crime, PC=Property crime
How we determined the safest cities
Learn how we identified the safest cities on our methodology page.
How to make a safe home anywhere
Over 6 in 10 Americans surveyed don't have a home security system, despite over 50% of all burglaries being residential. Unfortunately, a majority of people who have a security system added it after they had a break-in. One of the best ways to stop a burglary before it happens—and get immediate help if a break-in is detected—is to add a monitored home security system.
Get a home security system
Find out which companies we recommend for every budget and lifestyle in our roundup of the best security systems—and learn the basics of how to choose a security system.
Compare top security systems
Brand | Installation type | Self-monitoring option | Monthly cost
| Contract required | Learn more |
| DIY | $31.99/mo. | No | View packages | ||
| Pro | $39.99/mo. | No * | View packages | ||
| DIY | $19.99/mo. | No * | View packages | ||
 | Pro | $45.99/mo. | Yes | View packages |


Info current as of post date. Offers and availability may vary by location and are subject to change. Full ADT disclaimer
Related articles on SafeWise
Endnotes and sources
Find all endnotes and sources in our full methodology.
FBI Crime Data Explorer, "Documents & Downloads." Accessed March 17, 2025.
- 2023 Crime in the United States Annual Reports
- Offenses Known to Law Enforcement
- 2023 NIBRS Estimation Tables
Bureau of Justice Statistics, "National Incident-Based Reporting System (NIBRS)." Accessed March 17, 2025.
Gun Violence Archive, "Mass Shootings." Accessed March 17, 2025.
Recent Articles
Security Camera Laws, Rights, and Rules 2026
Laws about how to legally use security cameras vary from state to state. We look...

7 Best Home Security Systems of 2026 | Reviewed and Tested by Experts
Looking for the best home security systems of 2026? Our expert test and rank SimpliSafe...

Can a Smart Shipping Label Stop Porch Pirates? | ZFLO & ZakTrak
We sat down with Founder & CEO Larry Fox to learn more about this smart...
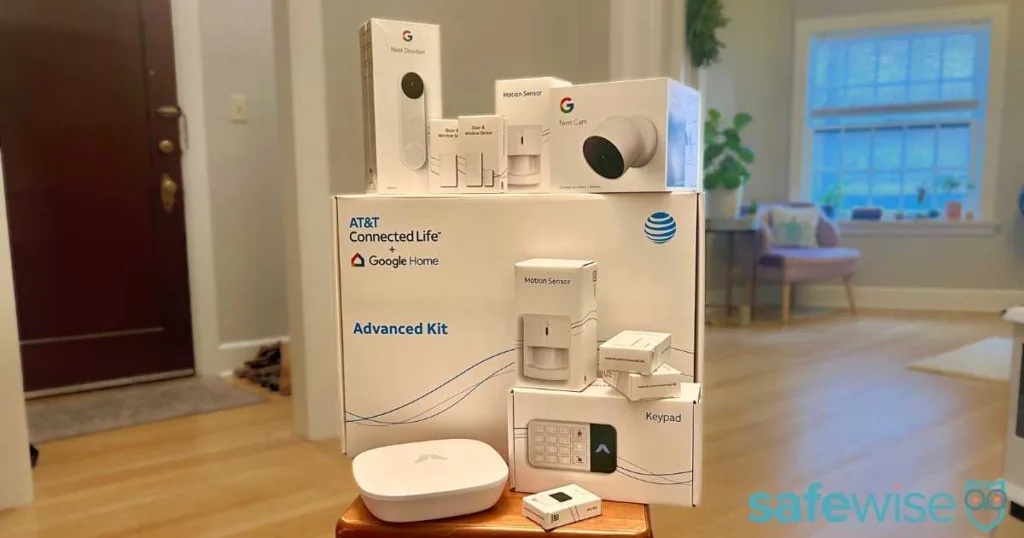
How to Get Smarter Home Security: AT&T’s New Google Home Solution
AT&T just launched Connected Life, a new home security system using Google Nest cameras and...