Find out which metro areas reported the most crimes in our Dangerous Metro Areas report.
The 10 Safest Big Cities in the US for 2022
Why you can trust SafeWise
products considered
250+
research hours in 25+ in-home tests
10k+
years of combined experience
176+
homes and people protected
10M+
For over 13 years, SafeWise experts have conducted independent research and testing to write unbiased, human reviews (not robots). Learn more.
There's no avoiding that violent crime—especially gun violence—is rising in America's biggest cities. Portland, Oregon, and Rochester, New York declared gun violence states of emergency over the summer, likely inspired by last year's statewide declaration in New York. At the national level, The White House and the FBI are working to tackle the scourge of gun violence.
While today's headlines show law enforcement taking gun violence more seriously, our analysis of America's major metro areas shows that there's still room for improvement as violent crime rates have increased over the last year. The good news is that property crime rates are still dropping across the US—regardless of whether a metro reports the most or the fewest crimes to the FBI.
We're hopeful that a one-year rise in violent crime rates turns out to be more of a blip than a trend—violent crime in the US has declined over 47% since peaking in 1991, according to FBI data. If you live in a major metro area or know someone who does, here's a deeper dive into big cities with the lowest rates of crime incidents—including demographic information and other community insights.
How worried are you about gun violence?
Learn more about gun violence across the US—and how much Americans worry about it—in our ongoing coverage of the facts and the fears surrounding this important topic.
Curious about crime and safety in your area?
We've got the goods. Sign up for our weekly newsletter emails to get the latest safety news and tips to make your life safer.
By signing up, you agree to our Terms and Conditions and Privacy Policy.
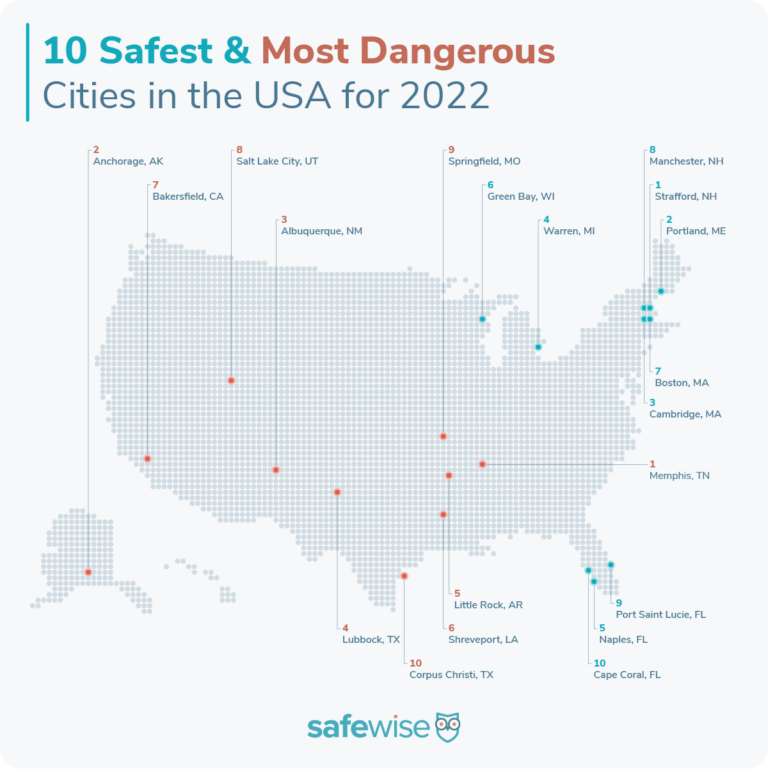
Here are the 10 safest big metros in the US for 2022:
- Rockingham County-Strafford County, NH
- Portland-South Portland, ME
- Cambridge-Newton-Framingham, MA
- Warren-Troy-Farmington Hills, MI
- Naples-Marco Island, FL
- Green Bay, WI
- Boston-Cambridge-Newton, MA-NH
- Manchester-Nashua, NH
- Port St. Lucie, FL
- Cape Coral-Fort Myers, FL
Learn more about every metro area that made our list
How these cities ranked safest
When looking at crime rates and trends across the most populated areas of the US, we decided it made more sense to compare metropolitan statistical areas (MSAs) instead of standalone big cities.
MSAs include major "anchor cities" and outlying communities with high social and economic integration. So it paints a more accurate picture of both crime and the socioeconomic factors impacting the quality of life for residents.
Interestingly, we found that when you compare the crime rates of a big city proper with those of its MSA, the number of crimes per 1,000 people tends to go down.
To start with the levelest playing field, we use FBI Uniform Crime Report statistics to determine the rankings for the "safest" metro areas. This data isn't perfect—it's self-reported by law enforcement agencies yearly—but it's the most comprehensive US crime data available.
We look at both property and violent crime—calculating the rate of each per 1,000 people. That's where the ranking comes from—if a metro area reports the lowest weighted and normalized violent and property crime rates per 1,000 residents, it lands at the top of the list. Those with higher crime rates fall to the bottom.
If a metro area didn't submit a complete report to the FBI or doesn't meet our population threshold of at least 300,000 people, we don't consider it for ranking.
We also explore median household income, employment, education, and annual budgets for more context about the "safest" and "most dangerous" metros. This contextual data doesn't factor into our scoring.
Read our complete safest cities reporting methodology.
For the purposes of this report, the terms "safest" and "dangerous" refer explicitly to crime rates as calculated from FBI crime data—no other characterization of any community is implied or intended.
What it's like to live in the safest metro areas in America
We all know that big cities come with more people, which can mean more big-city headaches like traffic, pollution, and finding an affordable place to live. But big cities come with perks too. Things like museums, more job opportunities, and better public transportation help make life easier when you call a big metro area home.
Things typically get even better in our safest metros. If you live in one of the safest metros, you might relate to the following findings.
People in these metros worry less about violent crime and property crime.
- On average, people from the states home to our safest metros are less worried (46%) about crime and safety than nationwide (47%).
People in these metros are less likely to live below the poverty line.
- The percentage of people in the safest metros who live below the poverty line is 25% lower than the US average.
Salaries in these metros are higher than the national average.
- The average median household income among the safest metros is $75,928—that's 17% above the national average.
These metros spend less on public safety than the most dangerous cities we ranked.
- The safest metros spend around 42% less on public safety than the most dangerous big cities.
These metros spend less on community services than the most dangerous cities we ranked.
- The safest metros spend 1% less on community resources than the most dangerous big cities.
These metros have more high school graduates than the average American city.
- Around 92% of people who live in the safest big cities have a high school diploma or higher—that's 3% more than the national average.
Unemployment rates in these metros are lower than in the average American city.
- The average unemployment rate among the safest metros (2.8%) is 36% lower than in the most dangerous cities (4.3%).
How has crime changed in the last year in the safest metros?
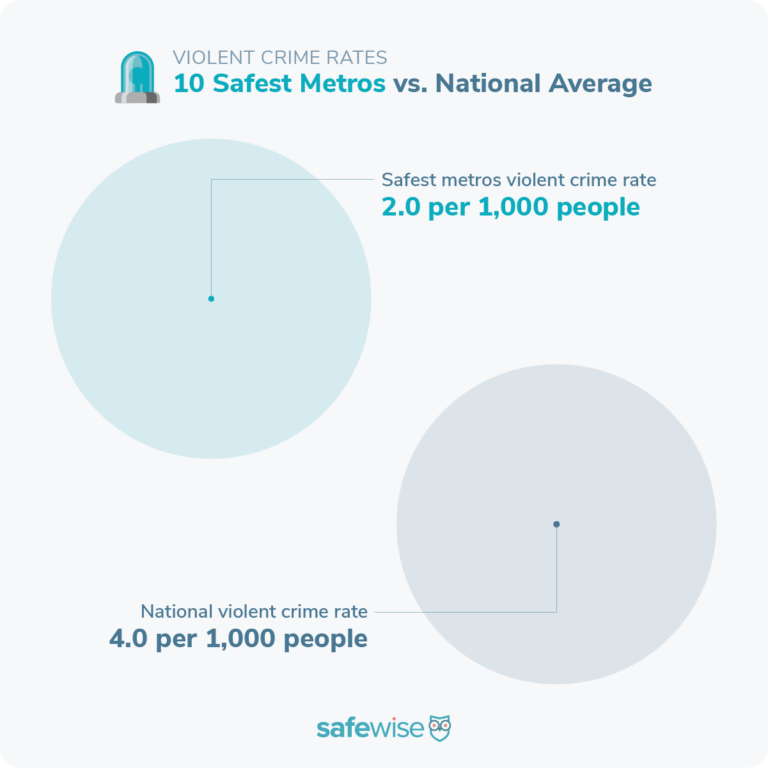
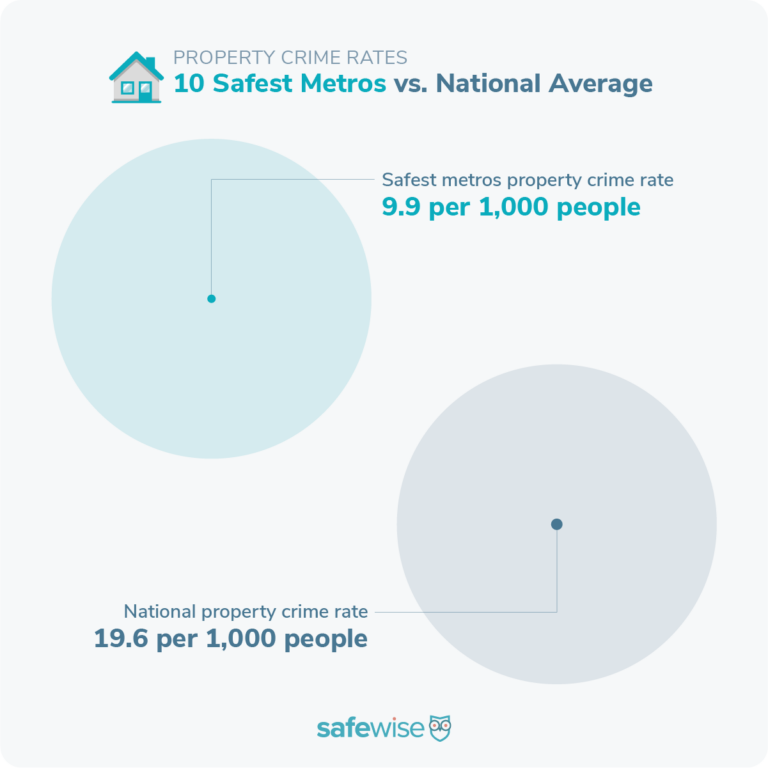
Among the safest and most dangerous metros, violent crime rates increased in prevalence while property crime rates decreased year over year. This matches recent national crime rate trends.
America's violent crime rate increased for the first time since 2016—from 3.7 incidents per 1,000 people last year to 4.0—a 5% increase. Although the average violent crime rate among the safest metros increased from 1.7 to 2.0—18% higher than the previous year—it's still half that of the national rate.
On the other side of the coin, property crimes continued a long decline—dropping 69% since 1991. The national property crime rate dropped from 21.1 to 19.6 year over year—a 7% decrease. The drop in the average property crime rate among the safest metros went further—from 11.4 to just 9.9. That's a 13% decrease, nearly double the improvements nationwide.
The most dangerous metros also showed an improvement in average property crime rates, but at just 4%, they're still lagging behind the nation and safest metros.
While an increase in violent crimes can bring new worries, the continued drop in property crimes in this year's report is worth celebrating.
Interesting safest and most dangerous metro findings
Safest metro area in America: Rockingham County-Strafford County, NH
Rockingham County-Strafford County, NH, tops our list for the second time after making its debut at number 1 last year. Here's why it was named the safest big city in America:
- Your risk of being the victim of a property crime in Rockingham County-Strafford County, NH, is 1 in 104, based on the latest FBI crime data. Your risk of being a victim of violent crime is 1 in 1,111.
- By comparison, in Memphis, TN (our most dangerous metro), your risk of being a victim of a property crime is 1 in 27. Your risk of being a victim of violent crime is 1 in 74.
New cities among the safest metros in the US for the first time
Four of the safest metro areas are new this year, including the largest on our list: Boston-Cambridge-Newton, MA-NH. It's not all that surprising since metro areas in New England make up half of the 2022 rankings. In addition to Boston, there are three other newbies:
- Manchester-Nashua, NH rounds out New England's roster at number 8.
- Port St. Lucie, FL, and Cape Coral-Fort Myers, FL—numbers 9 and 10, respectively—join Naples-Marco Island, FL, which has been on our list since 2020.
3 regions
All 10 of 2022's safest metro areas come from 3 US regions:
- New England (5 metros)
- Florida (3 metros)
- Upper Midwest (2 metros)
The safest metros don't see much murder
The top 10 safest metros reported 285 murder and non-negligent manslaughter incidents.
- That's 68% fewer murders than reported by the 10 most dangerous metros (that total is 888).
- The combined number of murders in the safest metros is 12% fewer than Memphis, the city on our lists that reported the most overall, 324.
Grand theft auto: Many cars swiped in the most dangerous metros
Car theft has been big business in the metro areas in recent years. Here's how common auto theft is in the safest and most dangerous metros.
- Just 11,620 car theft reports in the 10 safest metros—67% fewer than in the most dangerous.
- 35,281 motor vehicle thefts in the 10 most dangerous metros—a 4% decrease since last year.
How to make a safe home anywhere
We encourage everyone to be proactive about home security. One of the best ways to stop a burglary before it happens is to add a home security system.
Get a home security system
Find out which companies we recommend for every budget and lifestyle in Safewise's expert review on top alarm companies—and learn the basics with our guide on Everything You Need to Know About Home Security.
Compare the best home security systems
Brand | Self-monitoring option | Monthly cost
| Starter equipment price | Break-in deterrent(s)
| Smart home compatibility
| Learn more |
| $28.99/mo.* | $0.00 | Smart AI detection, 2-way talk, Yard sign/window decal | Google, Z-Wave | View packages | ||
| $22.80/mo. | $250.96 | Active Guard, AI detection, Live agent intervention, Siren | Amazon, | View packages | ||
| $24.99/mo. | $199.00 | Smart Deter lurker detection, Lights, Sounds | Amazon, Google, Z-Wave | View packages | ||
| $19.99/mo. | Custom | Motion sensors/cameras, Glass break sensor, Siren | Amazon, Google | View packages | ||
| $26.99/mo. | $65.00 | Acoustic/vibration sensors, AI-powered alerts, Smart security integration | Amazon, Google, Apple, Z-Wave, Zigbee | View packages |


Info current as of post date. Offers and availability may vary by location and are subject to change. *ADT $28.99 for landline system only. Full ADT disclaimer
Find the Safest Cities in each state
Click on the state image below to check out the safest cities for each state—and find out how people in your state feel about crime and safety in our State of Safety report.
Contributing writer: Rebecca Edwards
Related articles on SafeWise
Endnotes
1. Median income, poverty line, and high school graduation statistics
- US Census Bureau (2020), "American Community Survey 5-year estimates," Retrieved from Census Reporter Profile page for each metro area and the United States. Accessed October 7, 2022.
2. Unemployment rates
- US Bureau of Labor Statistics, "Local Area Unemployment Statistics, Unemployment Rates for Metropolitan Areas, Annual Averages," August 2022. Accessed October 7, 2022.
3. City budget allocations
Note: City budget data comes from the first city listed in the metro area—usually the most populated. We refer to these representative samples of a metro area as "anchor cities."
- Rockingham County, "Fiscal Year 2021 Delegation Approved Budget." Retrieved from pages 1 and 24. Accessed April 19, 2025.
- City of Portland, Maine "FY21 Municipal Budget." Retrieved from page 10. Accessed October 7, 2022.
- City of Cambridge, Massachusetts, "Annual Budget 2020-2021." Retrieved from page 109. Accessed October 7, 2022.
- City of Warren, Michigan, "Budget, Fiscal Year July 1, 2020 Through June 30, 2021. " Retrieved from page 39. Accessed October 7, 2022.
- City of Naples, Florida, "Fiscal Year 2020-2021." Retrieved from pages 18 and 49. Accessed October 7, 2022.
- City of Green Bay, Wisconsin, "2020 Budget." Retrieved from page 8. Accessed October 7, 2022.
- City of Boston, Massachusetts, "Operating Budget." Retrieved from page 29. Accessed October 7, 2022.
- City of Manchester, New Hampshire, "Budget Information." Accessed October 7, 2022.
- City of Port St. Lucie, Florida, "Adopted Budget FY 2020-21." Retrieved from pages 21 and 80. Accessed October 7, 2022.
- City of Cape Coral, Florida, "Fiscal Years 2021 - 2023 Proposed Budget." Retrieved from pages 17, 122, and 127. Accessed October 7, 2022.
Recent Articles

Best Smoke Detectors of 2026
We reviewed the top fire and smoke alarms for your home in 2026. Protect your...

The Best Alexa-Compatible Home Security Systems
Best for built-in integration ADT Voice control of ADT system Works with Alexa Guard View...

Vivint App: A Complete Guide to Features and Use
Tour the Vivint app and discover its features, navigation, and customization capabilities. Learn how to...

Dangerous Apps for Kids: What Parents Need to Know in 2026
Dangerous apps for kids include ones you’ve heard of (TikTok, Instagram) and some new arrivals....