Find out which metro areas reported the fewest crimes in our Safest Big Cities report.
10 Most Dangerous Cities in the US
Why you can trust SafeWise
products considered
250+
research hours in 25+ in-home tests
10k+
years of combined experience
176+
homes and people protected
10M+
For over 13 years, SafeWise experts have conducted independent research and testing to write unbiased, human reviews (not robots). Learn more.
New FBI data shows nearly 1.3 million crimes occurred on school property from 2020–2024
Learn more about crime in schools and what you can do to help protect your child in our latest report.
Violent crime continues to haunt the headlines and, unfortunately, it’s not just clickbait. For the first time since 2016, violent crime rose nationwide—and the country’s biggest cities can sometimes be a stark reflection of that trend.
Memphis, the city that tops our list, has seen a series of violent incidents including the abduction and murder of a kindergarten teacher and a shooting rampage across the city that left four dead and three wounded.
These tragic events weren’t part of our ranking calculation, but Memphis’s climb to the number one spot indicates a pattern of escalating crime in Elvis Presley’s hometown. The Bluff City crept from number three in 2020 to number two in last year’s report; it landed on top with the highest collective crime rates this year.
How worried are you about gun violence?
Learn more about gun violence across the US—and how much Americans worry about it—in our ongoing coverage of the facts and the fears surrounding this important topic.
We used the most recent complete crime data from the FBI to identify which big US cities reported the most crimes.¹ Collectively, violent crime rose across the board year over year, but property crime in the metro areas we analyzed continued its downward trend, reflecting nationwide patterns.
The good news is that violent crime in the US has declined over 47% since peaking in 1991, according to FBI data. We’re hopeful the recent upward tick is more of a blip than a long-term trend.
If you live in a major metro area or plan to visit one, here's a deeper dive into the big cities with the highest rates of crime incidents—including demographic information and other community insights.
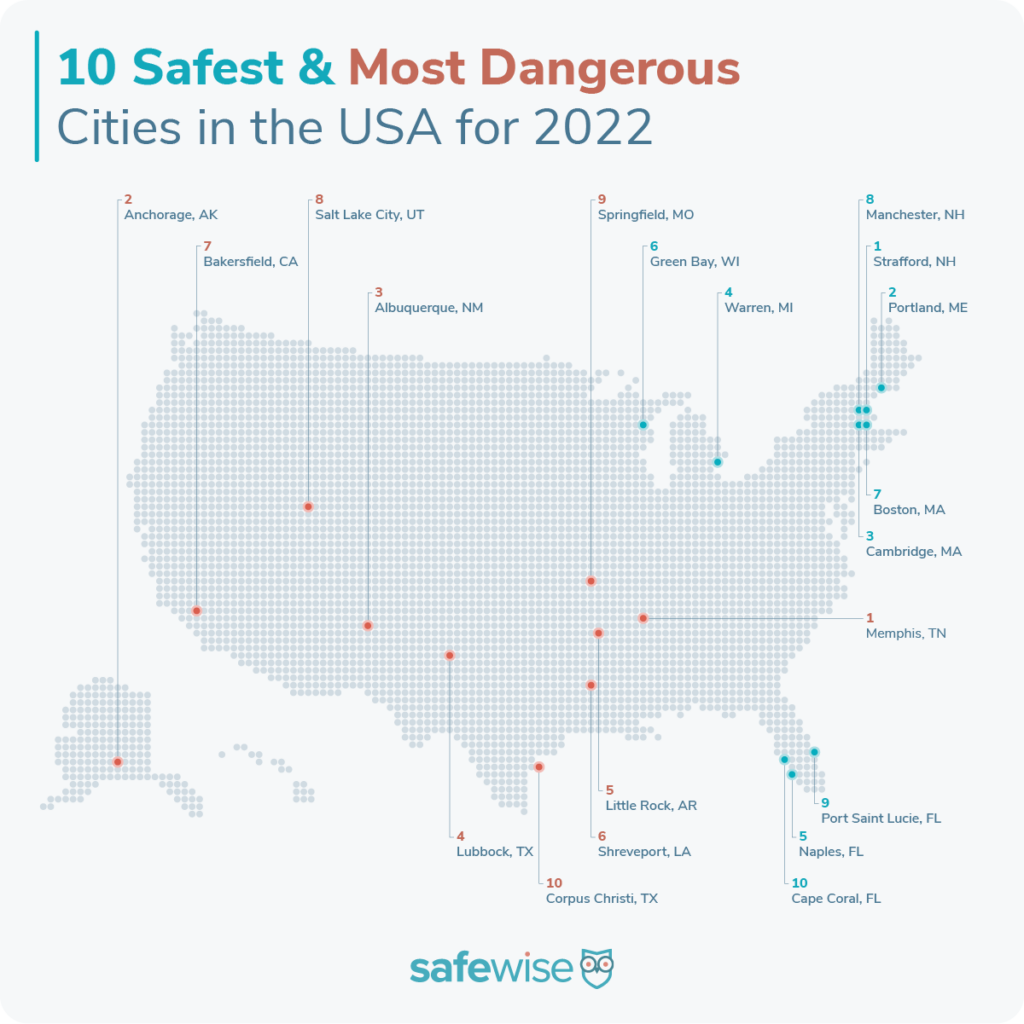
Here are the 10 most dangerous big cities in the US
Learn more about every metro area that made our list
How these cities ranked most dangerous
When looking at crime rates and trends across the most populated areas of the US, we decided it made more sense to compare metropolitan statistical areas (MSAs) instead of standalone big cities.
MSAs include major "anchor cities" and outlying communities with high social and economic integration. So it paints a more accurate picture of both crime and the socioeconomic factors impacting the quality of life for residents.
Interestingly, we found that when you compare the crime rates of a big city proper with those of its MSA, the number of crimes per 1,000 people tends to go down.
We started with per capita crime rates for each MSA, based on FBI crime and population data. This data isn't perfect—it's self-reported by law enforcement agencies yearly—but it's the most comprehensive US crime data available.
We look at both property and violent crime—calculating the rate of each per 1,000 people. That's where the ranking comes from—if a metro area reports the lowest weighted and normalized violent and property crime rates per 1,000 residents, it lands at the top of the list. Those with higher crime rates fall to the bottom, with the lowest 10 making up the list of “most dangerous” big cities.
If a metro area didn't submit a complete report to the FBI or doesn't meet our population threshold of at least 300,000 people, we don't consider it for ranking.
We also explore median household income, employment, education, and annual budgets for more context about the "safest" and "most dangerous" metros. This contextual data doesn't factor into our scoring.
Read our complete safest cities reporting methodology.
For the purposes of this report, the terms "safest" and "dangerous" refer explicitly to crime rates as calculated from FBI crime data—no other characterization of any community is implied or intended.
What about New York City?
The country’s biggest city is always conspicuously absent from our report, and inquiring minds want to know why. The reason is that NYC doesn’t participate in the FBI’s crime report collection. But we can give you some insight into crime in the Big Apple:3
- Over the past two years, major crimes have surged 27% overall, with robberies, burglaries, and larceny-thefts leading as the most-reported major crimes.
- NYC reports an overall crime rate of 13.3 major crimes per 1,000 people, with 2.8 violent crimes per 1,000.
What it's like to live in the most dangerous metro areas in America
Big-city life can be fast paced, exciting, and full of challenges. More people, more problems (am I right?). To give context outside of crime rates, we dug into socioeconomic and lifestyle factors among the most dangerous cities in the US—like poverty rate, high school graduation rate, and median household income.
Here’s how the most dangerous metros measure up in some key areas:
People in these metros worry more about violent crime and property crime.
- On average, people from the states home to our most dangerous metros are more worried (49%) about crime and safety than nationwide (47%).
These metros have smaller populations.
- The most dangerous metros are home to almost 350,000 fewer people than the safest metros, on average (430,000 versus 787,000).
- Only 2 of the most dangerous metros have populations over 1 million, with 1.3 million in Memphis being the largest. The safest metros have 3 cities over 2 million, with 4.8 million in the Boston area being the largest.
People in these metros are more likely to live below the poverty line.
- 80% of the most dangerous metros have more people living below the poverty line than the national average.
Salaries in these metros are lower than the national average.
- The average median household income among the most dangerous metros is $58,692—that's 13% below the national average.
These metros spend more on public safety than the safest cities we ranked.
- The most dangerous metros spend around 74% more on public safety than the safest big cities.
- These cities spend an average of 33% of their city budgets on public safety, versus only 19% in the safest metros.
These metros have about the same number of high school graduates as the average American city.
- About 88% of people who live in the most dangerous big cities have a high school diploma or higher—that's on par with the national average—and 4 metros come in with high school graduation rates over 90%.
- Last year, the most dangerous metros had 2.5% fewer graduates than the US average.
Unemployment is higher in the most dangerous metros.
- The average unemployment rate among the most dangerous cities (4.0%) is about 30% higher than the safest metros (2.8%).
Compare the best home security systems
Brand | Self-monitoring option | Monthly cost
| Starter equipment price | Break-in deterrent(s)
| Smart home compatibility
| Learn more |
| $28.99/mo.* | $0.00 | Smart AI detection, 2-way talk, Yard sign/window decal | Google, Z-Wave | View packages | ||
| $22.80/mo. | $250.96 | Active Guard, AI detection, Live agent intervention, Siren | Amazon, | View packages | ||
| $24.99/mo. | $199.00 | Smart Deter lurker detection, Lights, Sounds | Amazon, Google, Z-Wave | View packages | ||
| $19.99/mo. | Custom | Motion sensors/cameras, Glass break sensor, Siren | Amazon, Google | View packages | ||
| $26.99/mo. | $65.00 | Acoustic/vibration sensors, AI-powered alerts, Smart security integration | Amazon, Google, Apple, Z-Wave, Zigbee | View packages |


Info current as of post date. Offers and availability may vary by location and are subject to change. *ADT $28.99 for landline system only. Full ADT disclaimer
How has crime changed in the last year in the most dangerous metros?
In step with national trends, violent crime rates increased year over year in both the safest and most dangerous metro areas, while property crime rates dropped across the board.
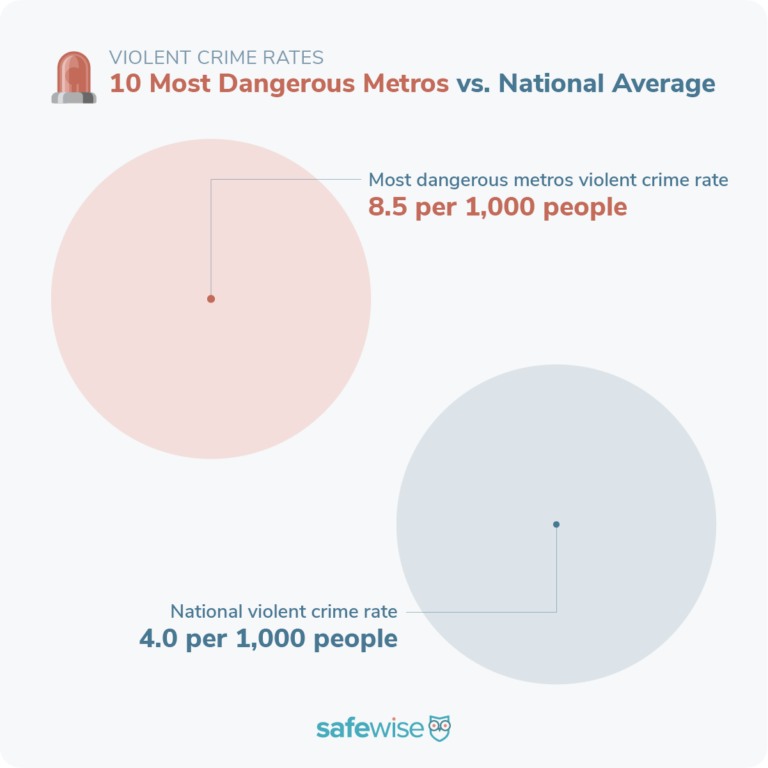
America's violent crime rate increased for the first time since 2016—from 3.7 incidents per 1,000 people last year to 4.0—a 5% increase. Although the average violent crime rate among the most dangerous metros increased from 7.9 to 8.5—8% higher than the previous year—these cities still saw a smaller jump than the safest metros. Violent crime in the safest metros rose 18% year over year, from 1.7 incidents per 1,000 people to 2.0.
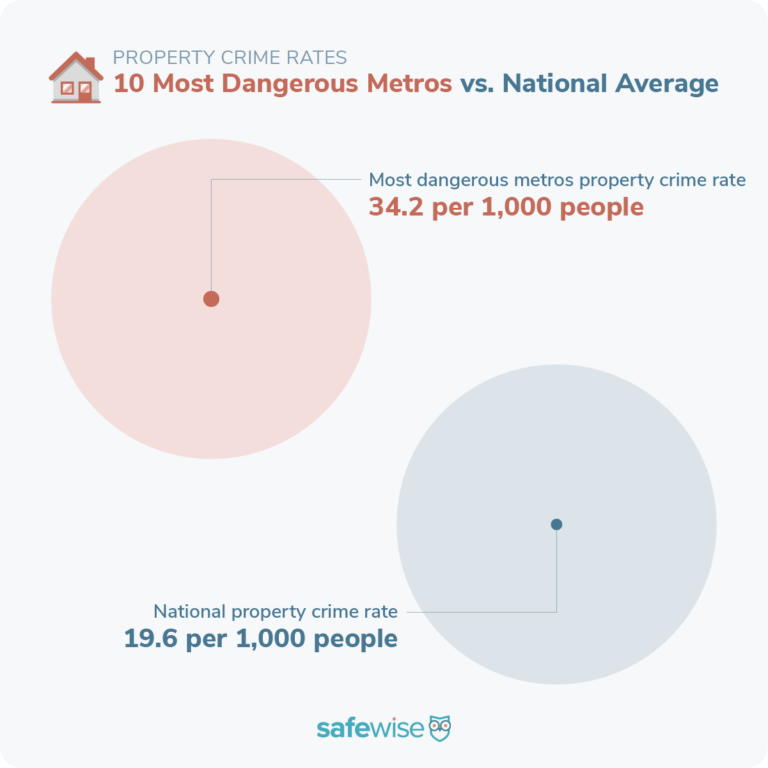
On the other side of the coin, property crime continued a sustained decline—dropping 69% since 1991. The national property crime rate dropped from 21.1 to 19.6 year over year—a 7% decrease. Among the most dangerous metros, property crime fell 4% collectively, from 35.5 incidents per 1,000 people to 34.2. The drop in the average property crime rate among the safest metros went further—from 11.4 to just 9.9. That's a 13% decrease, nearly double the gain nationwide.
While an increase in violent crimes can bring new worries, the continued drop in property crimes in this year's report is worth celebrating.
Violent crime is still lower than the highs we saw in the ‘90s
There’s no denying the alarm that comes with rising violent crime rates, and they shouldn’t be ignored or diminished. But it can be reassuring to put today’s violent crime patterns into a historical context.
- The US homicide rate fell by more than 50% between 1991 and 2014—from 9.8 murders per 100,000 people to 4.4.
- In 2020, the US homicide rate came in around 6.5 incidents per 100,000, which hasn’t been seen since the late ‘90s but is still below the 9.8 peak.
- The number of violent crimes per 100,000 people in 2020 (398.5) is relatively flat compared to a decade ago. In 2010, the US saw 404.5 violent crimes per 100,000 people.
2014 boasts the lowest violent crime rate of the last decade, with 361.6 violent crimes reported per 100,000.
Interesting safest and most dangerous metro findings
Most dangerous metro area in America: Memphis, TN-MS-AR
Memphis unseated Anchorage, AK, which topped our list for the past two years. Here's why it ranks first:
- In Memphis, TN (our most dangerous metro), your risk of being a victim of a property crime is 1 in 27. Your risk of being a victim of violent crime is 1 in 74.
- By comparison, your risk of being the victim of a property crime in Rockingham County-Strafford County, NH (our safest metro), is 1 in 104, based on the latest FBI crime data. Your risk of being a victim of violent crime is 1 in 1,111.
New cities among the most dangerous metros in the US for the first time
Three of the most dangerous metro areas are new this year: Albuquerque (3), Little Rock (5), and Salt Lake City (8). Both Albuquerque and Little Rock failed to report complete data to the FBI in 2019, which excluded them from the 2021 report. Here’s a closer look at Salt Lake City’s descent into the most dangerous big cities.
- Salt Lake City, UT, was 107 out of 131 cities in last year’s ranking, making it the 25th most dangerous city in the US. This year’s jump to number 8 was a big surprise—especially to this former SLC resident.
- Property crime is Salt Lake City’s undoing. The city reported the highest property crime rate among the most dangerous cities: 38.2 incidents per 1,000, 4 more than the average among all the metros on our list.
- On the flip side, Salt Lake City comes in with flying colors for violent crime. Not only is its rate of 3.7 incidents per 1,000 the lowest on the list, it’s also lower than the US average.
When it comes to crime, size does matter
The two most populous cities reported the largest numbers of crimes.
- Memphis, the biggest metro on the list, accounted for 30% of all the violent crimes reported among the most dangerous metros.
- Combined, Memphis and Salt Lake City—the only cities with over 1 million residents—reported around 40% of the total property crimes among the most dangerous cities.
State with the most dangerous metro areas: Texas
Everything’s bigger in Texas, including the number of major metros with higher crime rates. Last year, California claimed this dubious distinction with three cities landing in the top 10.
- Corpus Christi and Lubbock remained among the most dangerous metros in the US for the second consecutive year, but both cities saw improvement year over year.
- Lubbock fell one spot from number 3 last year, despite a rise in violent crime from 8.3 to 9.2 incidents per 1,000. Thankfully, a 9% drop in property crime (from 40.2 to 36.5) helped Lubbock improve overall.
- Corpus Christi dropped from number 7 to the bottom of the list this year. The violent crime rate held steady at 7.4 and property crime plummeted 7% year over year, to fewer than 30 incidents per 1,000.
How to make a safe home anywhere
Whether your city made our list or not, we encourage everyone to be proactive about home security. One of the best ways to stop a burglary before it happens is to add a home security system.
We found the best home security options for nearly every budget, including self-monitored systems with no monthly fees and professionally monitored systems starting as low as $10 per month.
Get a home security system
Find out which companies we recommend for every budget and lifestyle in Safewise's expert review on household alarm systems—and learn the basics with our guide on Everything You Need to Know About Home Security.
Find the Safest Cities in each state
Click on the state image below to check out the safest cities for each state—and find out how people in your state feel about crime and safety in our State of Safety report.
Related articles on SafeWise
Endnotes
1. Median income, poverty line, and high school graduation statistics
- US Census Bureau (2020), "American Community Survey 5-year estimates," Retrieved from Census Reporter Profile page for each metro area and the United States. Accessed September 14, 2022.
2. Unemployment rates
- US Bureau of Labor Statistics, "Local Area Unemployment Statistics, Unemployment Rates for Metropolitan Areas, Annual Averages," August 2022. Accessed September 14, 2022.
3. City budget allocations
Note: City budget data comes from the first city listed in the metro area—usually the most populated. We refer to these representative samples of a metro area as "anchor cities."
- City of Memphis, Tennessee, "FY 2021 Adopted Operating Budget." Retrieved from page 24. Accessed October 7, 2022.
- Municipality of Anchorage, Alaska "General Government Revised Budget," April 26, 2022. Retrieved from page 5. Accessed October 7, 2022.
- Detroit, Michigan, "FY 2020-2021 Adopted Budget." Retrieved from page 1. Accessed October 7, 2022.
- City of Lubbock, Texas, "Adopted Operating Budget & Capital Program," October 1, 2020. Retrieved from page 33. Accessed October 7, 2022.
- City of Little Rock, Arkansas, "2021 Annual Operating Budget." Retrieved from page 89. Accessed October 7, 2022.
- City of Shreveport, Louisiana, "2021 Annual Operating Budget." Retrieved from page 8. Accessed October 7, 2022.
- City of Bakersfield, California, "Budget Expenditures Broken Down by Department." Retrieved from page 31. Accessed October 7, 2022.
- Salt Lake City, Utah, "Capital and Operating Budget FY 2020-2021." Retrieved from page 27. Accessed October 7, 2022.
- City of Springfield, Missouri, "FY 2020-2021 Adopted Annual Budget." Retrieved from pages 51, 163, and 217. Accessed October 7, 2022.
- City of Corpus Christi, Texas, "Proposed Operating Budget," July 28, 2020. Retrieved from pages 46, 164. Accessed October 7, 2022.
Recent Articles

Best Smoke Detectors of 2026
We reviewed the top fire and smoke alarms for your home in 2026. Protect your...

The Best Alexa-Compatible Home Security Systems
Best for built-in integration ADT Voice control of ADT system Works with Alexa Guard View...

Vivint App: A Complete Guide to Features and Use
Tour the Vivint app and discover its features, navigation, and customization capabilities. Learn how to...

Dangerous Apps for Kids: What Parents Need to Know in 2026
Dangerous apps for kids include ones you’ve heard of (TikTok, Instagram) and some new arrivals....